Adyen is one of the world’s most significant payments processors, but the company provides only limited insight into its cross-border payments operations. We dig into recent numbers to determine what we can learn.
Providing the ability to receive payments from shoppers all over the world using a wide variety of payment methods is central to Adyen’s offering, and one of the reasons it is favoured by leading brands including Uber, eBay, McDonalds and Microsoft.
Having begun as a provider of ecommerce payment solutions, the company has grown to become a multichannel provider, offering solutions across both retail and online settings. In pursuit of a seamless experience for its customers’ users, the company pairs these with local acquiring to provide widespread cross-border payments support across all its channels.
However, while cross-border payments undoubtedly plays a key role in its business, the exact level of contribution it provides is unclear, and Adyen has not provided any form of number breaking this out since before it went public on Amsterdam’s Euronext stock exchange in June 2018.
Nevertheless, information the company has shared in earnings and beyond does provide some sense of the likely split within the company, so in this report we dig into the details to get a greater sense of the significance of cross-border payments at Adyen.
Where cross-border payments occur in Adyen’s business offering
Catering to globally focused brands across marketplaces and a broad range of verticals – including hospitality, mobility, digital and retail – Adyen has evolved its offering to enable merchants to easily accept payments using a broad range of methods both online and offline.
Through this, businesses of all sizes can use Adyen to process transactions from payment types issued in a different country to the seller, both online and offline. In most cases, this is achieved through local acquiring, which sees Adyen using banks that are local to the buyer’s payment method to process their transaction, rather than the payment being directly processed cross-border. This approach reduces the risk of the transaction being declined and allows Adyen to enable its customers to take payments across a wide range of jurisdictions.
The company has local acquiring licences across Europe and the UK – as well as the US, Brazil, Canada, Hong Kong, Australia, New Zealand and Singapore – and uses local partners in other jurisdictions.
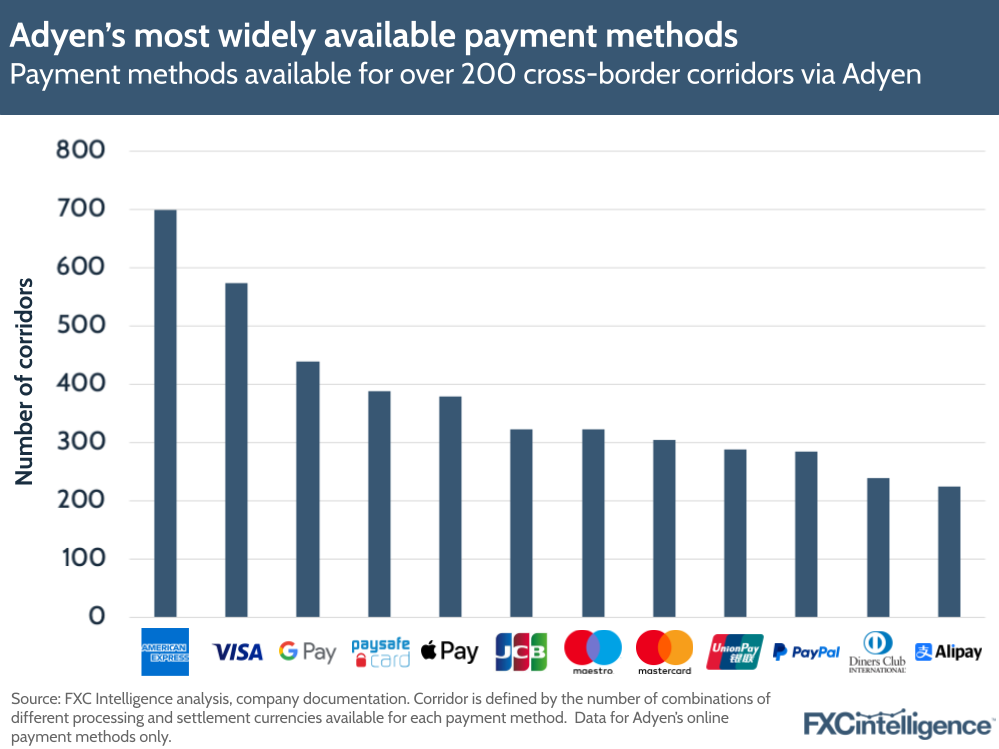
As part of this, customers can add payment acceptance support for additional methods, with the company supporting more than 90. Of these, 47% are available for more than one processing and settlement currency, meaning that they can be used to make cross-border payments via Adyen.
While the company supports a large number of highly localised payment methods, it also supports a smaller number of very widely available payment methods. For online payments, 23% of methods are available across more than 10 cross-border corridors, while 12 (13%) are available across more than 100.
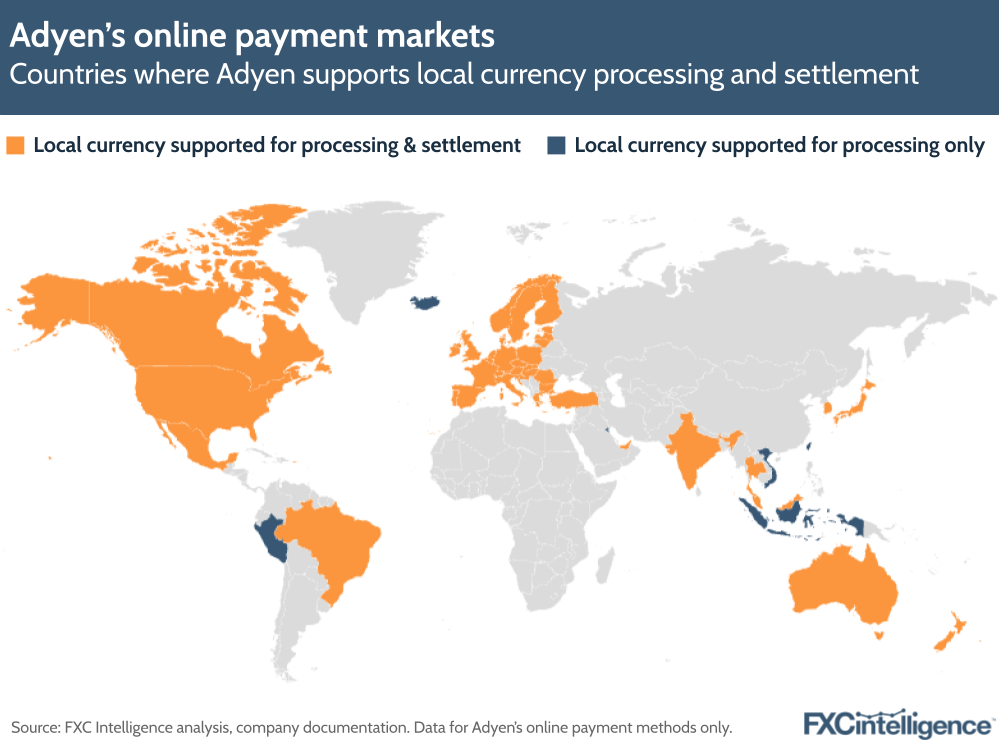
At present, Adyen provides online processing and settlement services between more than 2,000 corridors, with processing available in more than 60 currencies and settlement available in more than 30. These are predominantly in North America, Europe and Oceania, although the company does also provide processing and settlement services in several key Asian markets, including Japan, South Korea, Vietnam and Thailand, as well as Brazil.
Opportunities for Adyen to earn revenue from cross-border transactions
As Adyen acts as both the payment processor and acquirer, it is able to handle the entire process, providing multiple points where it has the opportunity to earn additional revenue from cross-border transactions.
On the processing side, there are several opportunities, which vary depending on which of Adyen’s products are involved and whether the payment is online or in-person.
At the top level, Adyen charges a fixed processing fee, which currently stands at €0.11 per transaction, plus a fee that varies by the payment method. In most cases, this is defined as commission and is fixed for each payment type in each country; however, where a payment method uses Interchange++ pricing, which accounts for variations in interchange fees, it is defined as a markup.
These fees vary significantly by retailer country and payment method – while some are a fixed value, many are a percentage of the transaction and can be anything from around 1.5% up to 12% in a small number of cases. This fee will include costs associated with working with any local financial institutions, as well as any fees from the payment method itself and cross-border costs where appropriate.
For in-person payments, Adyen also provides shoppers who are purchasing from abroad the ability to choose to pay in their own currency through its dynamic currency conversion feature. This is something retailers need to enable, but is widely available across almost all of its point-of-sale hardware and software integrations, as well as most of the markets where it offers a PoS solution.
When enabled, this prompts shoppers who are purchasing using a different billing currency to the local currency to choose between paying in the local currency or their own billing currency. Adyen displays both options, with the shopper given the price in each. The billing currency price will include a markup to the foreign exchange conversion that is applied.
For its Marketplace and Platform customers, the company is also piloting currency conversion, which allows customers to enable their users to offer different processing and settlement currencies. This is achieved through the use of daily exchange rates, which Adyen provides with a built-in markup.
Meanwhile, in situations where a payment has been processed in a different currency to the one it is settled in, Adyen will charge a markup on the currency conversion.
Finally, when paying out to sellers, Adyen provides a broad range of local pay-out options in many markets. However, for those who wish to pay out to accounts in countries beyond that in which their Adyen account is set up for, the company will settle the account via a cross-border transfer.
Context from Adyen’s H1 2024 earnings
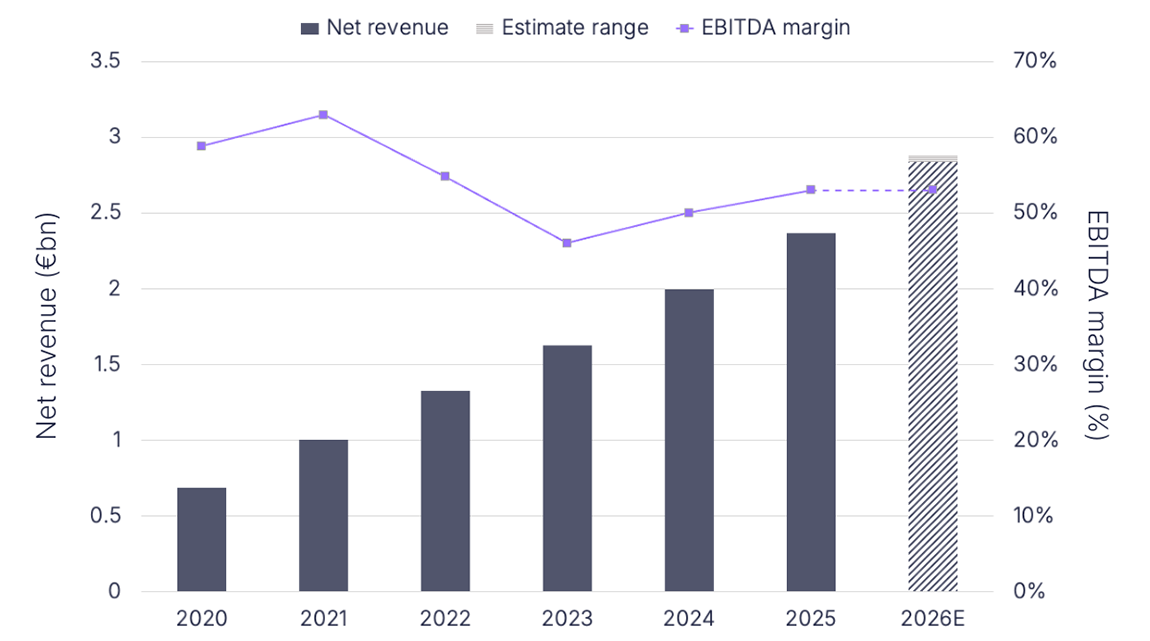
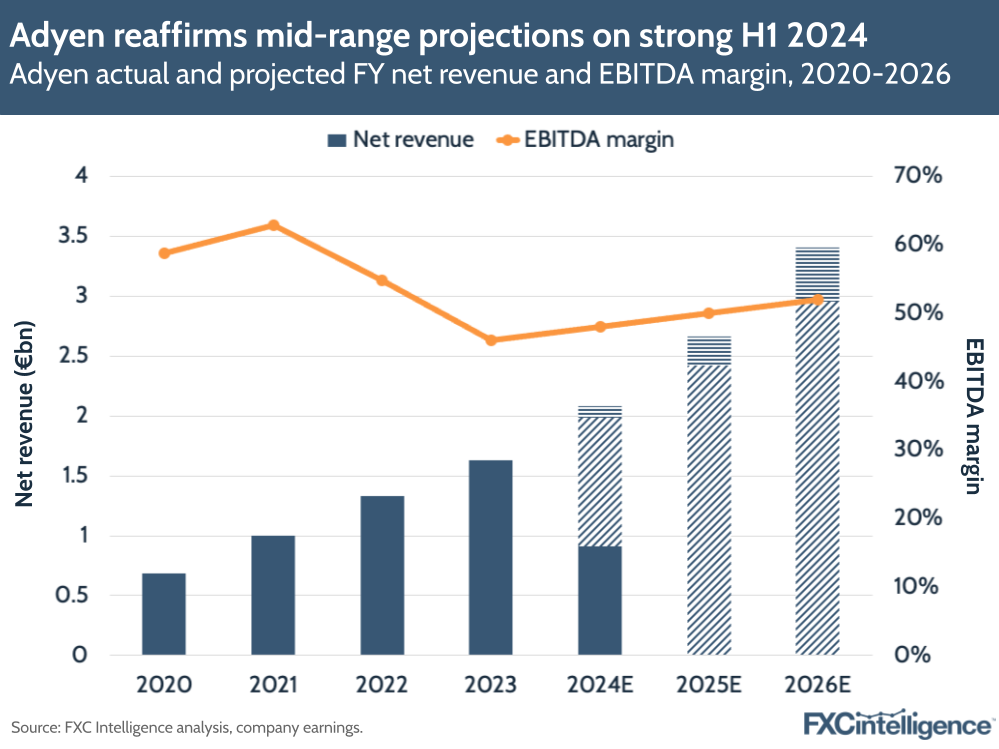
Reporting net revenue of €913m ($1bn) in H1 2024, a 24% YoY increase, Adyen pleased investors with its latest earnings report, beating expectations and topping profit forecasts.
This comes as the company continues to execute on a multi-year growth plan that sees it focus on cost-conscious market expansion, increasing EBITDA 32% YoY to €423m ($468m) for a margin of 46% – three percentage points above H1 2023. Meanwhile, it also kept hiring to a minimum, with full-time employee (FTE) numbers increasing by just 9% following a sustained period of significant FTE growth.
Through this approach, it is targeting annual net revenue percentage growth in the low to high twenties year-on-year up to 2026 and 50%+ EBITDA margins by 2026 – targets it reaffirmed in its latest earnings.
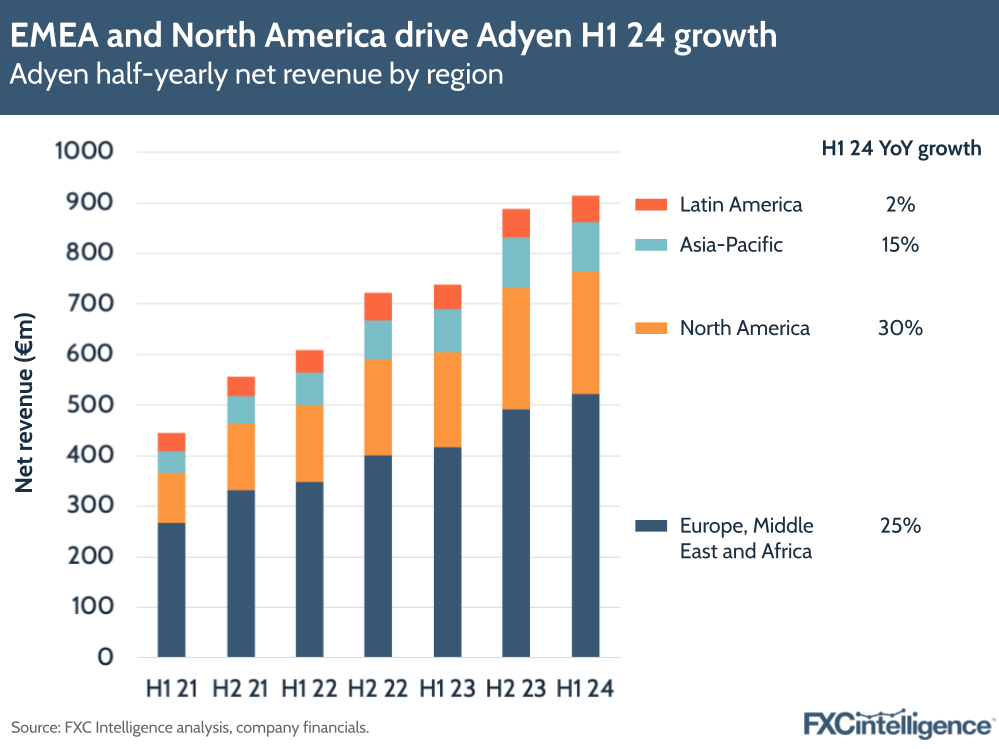
While the company has a strong presence in multiple regions globally, it performed strongest in North America, where revenue increased 30% YoY to €244m, while Europe, the Middle East and Africa, the largest region by revenue, saw growth of 25% to €522m.
While cross-border is a strong backdrop to many of its offerings, the company does not explicitly break out any numbers directly related to it and has not directly mentioned cross-border in an earnings call since H1 2020.
Retail growth and Adyen’s changing volume mix
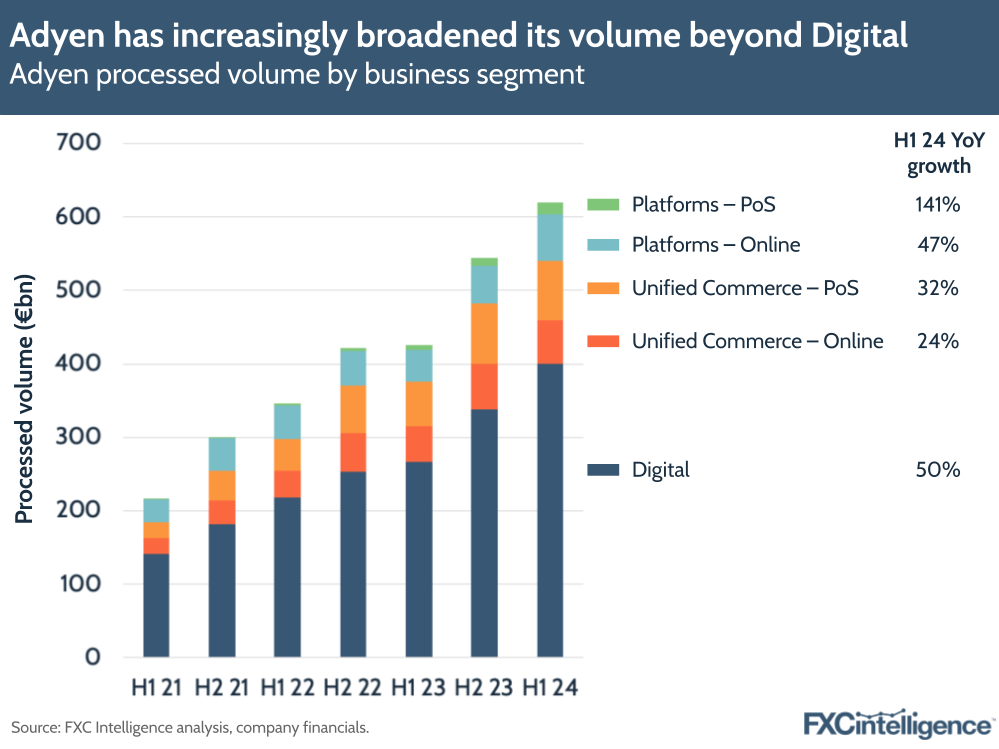
The company serves customers under three segments: Digital, which focuses on online brands that often deliver their products or services digitally; Unified Commerce, which allows customers with a physical and online footprint to engage with their customers in a multichannel manner; and Platforms, which provides payment services for platforms and marketplaces.
In H1 2024, all three saw strong growth in processed volume, with Unified Commerce seeing a 29% YoY increase to €141bn, while Digital increased by 50% to €399bn and Platforms increased by 59% to €79bn. Of these, Digital had the largest share of volume, at 65%, with Unified Commerce at 23% and Platforms at 13%.
This split is in part due to the age of the products. When Adyen began, Digital was its sole offering, and the product it has built its growth around. However, in the following years it broadened its product offering, adding point-of-sale solutions in 2012 and launching Adyen for Platforms in 2016. Its Unified Commerce solution has also been steadily expanded globally, reaching 27 markets when it was launched in Singapore in 2018 and adding numerous countries since, including Japan in 2022 and Malaysia in 2023.
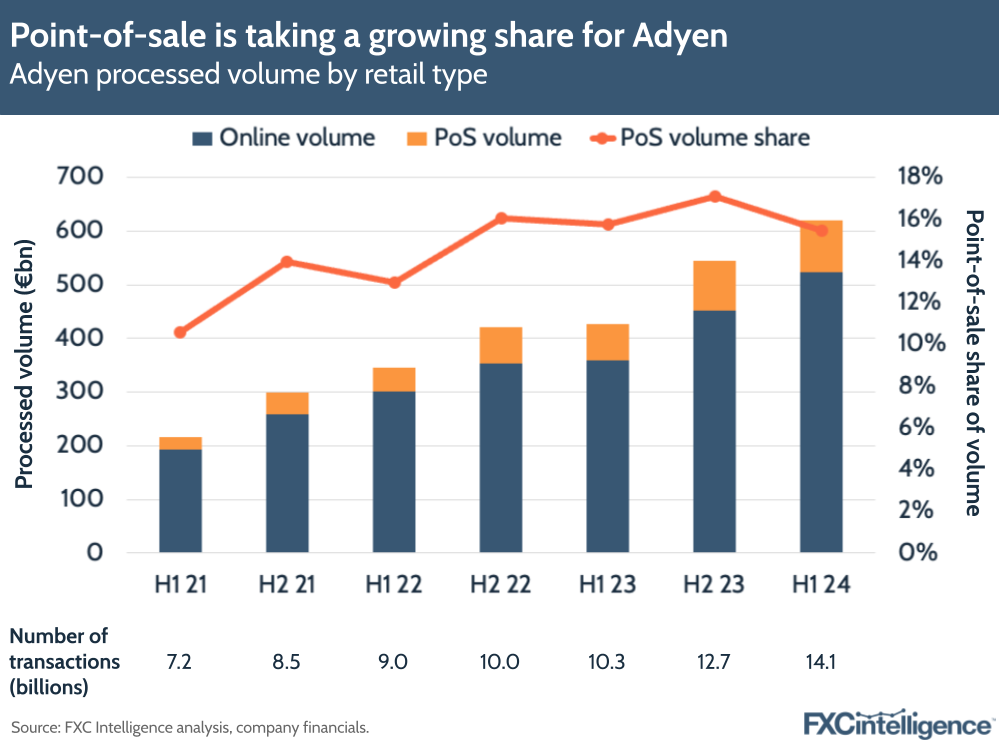
This means that while online commerce remains the biggest source of Adyen’s payments volume, accounting for 85% in H1 2024, the share from point-of-sale has been steadily rising. Both Platforms and Unified Commerce report PoS volume, which accounted for 19% of Platform volume and 57% of Unified Commerce volume.
In both cases, this share has increased over the past few years, although Platforms has seen a sharper increase. While PoS has seen a six percentage point increase in share of Unified Commerce volume since H1 2021, Platform PoS climbed 17 percentage points from a 2% share during the same period.
Given that point-of-sale has a lower share of cross-border volume than in the online space, this suggests that Adyen’s cross-border share of volume is likely to be going down – albeit slowly.
How much is cross-border contributing to Adyen’s bottom line?
While cross-border volume is likely to have reduced from 2014 levels, the revenue impact is less clear, particularly given that cross-border revenue comes from multiple sources and is not explicitly broken out.
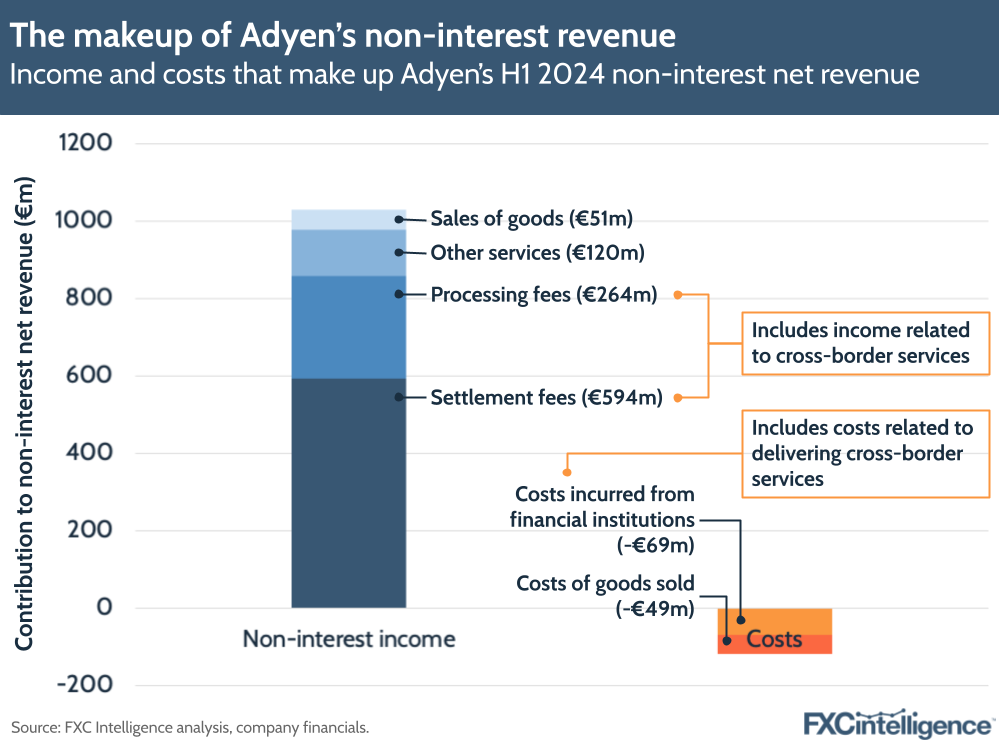
However, there are some indications within Adyen’s earnings. Adyen’s non-interest revenue, which in H1 2024 accounted for 99.7% of net revenue, includes settlement fees and processing fees, both of which are likely to include contributions from cross-border revenue, as well as costs incurred from financial services institutions, which include some costs associated with delivering cross-border payments.
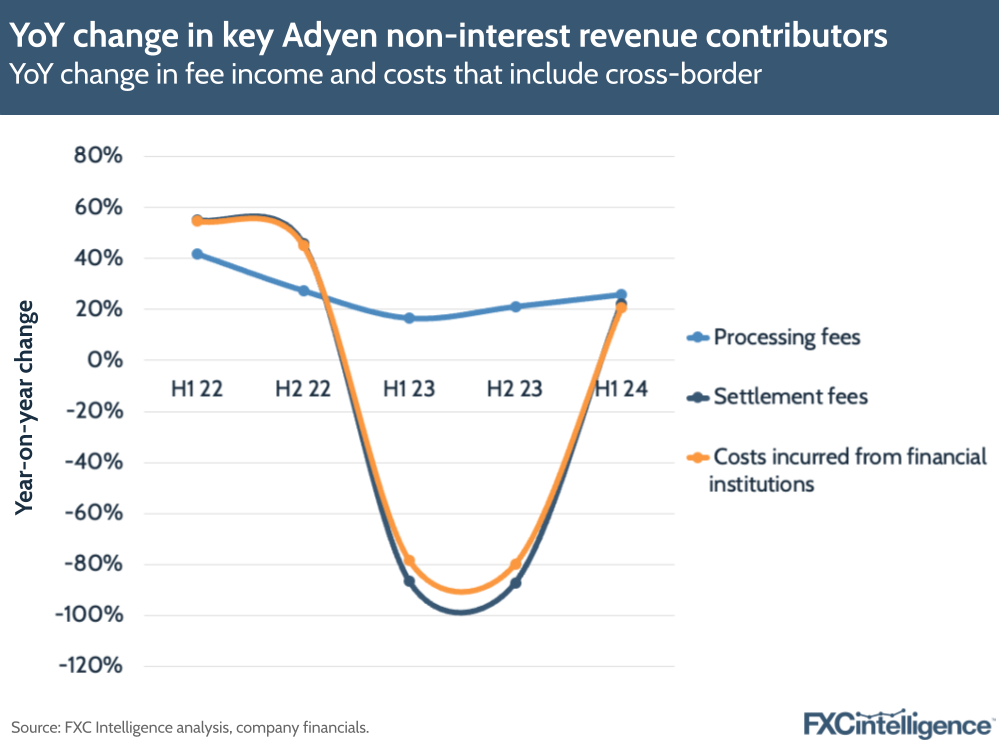
Both costs and fees can vary considerably by quarter, which is likely to be the result of changes in the third-party financial institutions the company is using as it adds new markets and acquires licences. This makes it difficult to track changes over time.
However, charting YoY change in processing fees, settlement fees and costs incurred from financial institutions shows that changes to settlement fees and financial institution costs track very closely. This suggests that these costs are largely covered by income from settlement fees.
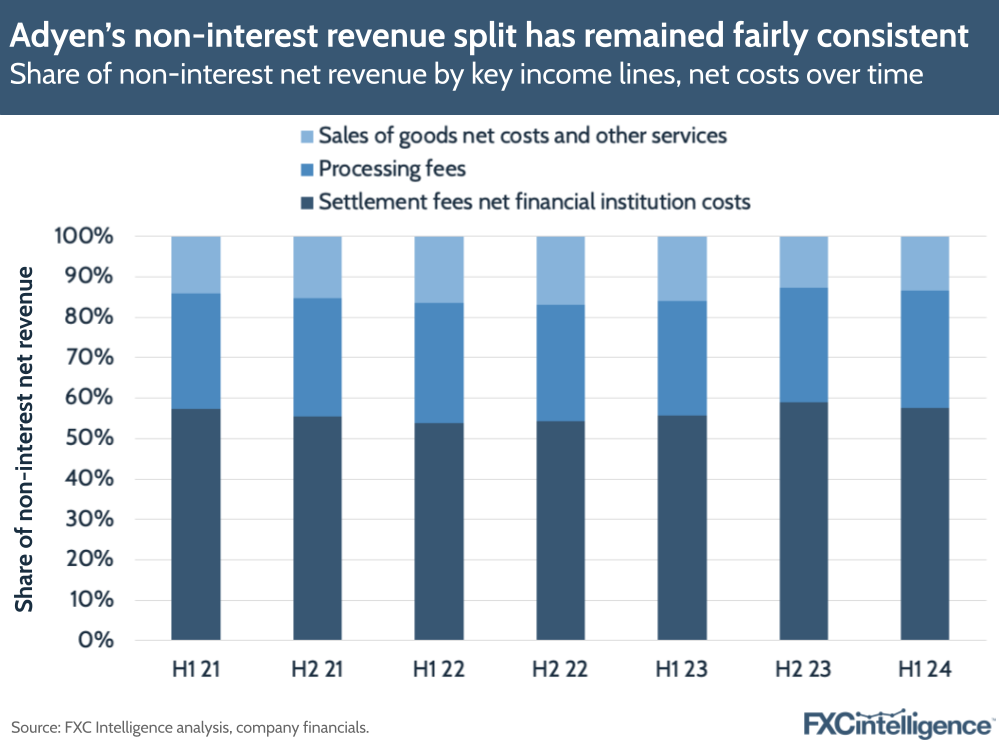
With this in mind, charting settlement fees net financial institution costs alongside processing fees and the remaining income combined into a single category provides insights into the company’s revenue split over time.
While there is a slight varying in some categories, there has not been a meaningful shift in contribution to net revenue between these categories over the past three years, with settlement fees net costs maintaining a share of between 54% and 59% during the period, while processing fees have maintained a share of between 28% and 30%.
While there are multiple contributors to these numbers, this does suggest that there is unlikely to have been a sharp change in the amount of cross-border payments the company has been handling during this period, with minor changes likely to be the result of seasonal shifts in shopping behaviour, as well as moves in consumer spending with the post-pandemic reopening.
Insights from the Paris Olympics
While in general the company does not share data related to its cross-border volume, Adyen did provide a rare insight when it published its Summer of Sports data trends this year. Set to run from 24 July 2024 to the first week of September, this tracker focuses on payments data from France over this summer period in order to align with the Olympics in Paris.
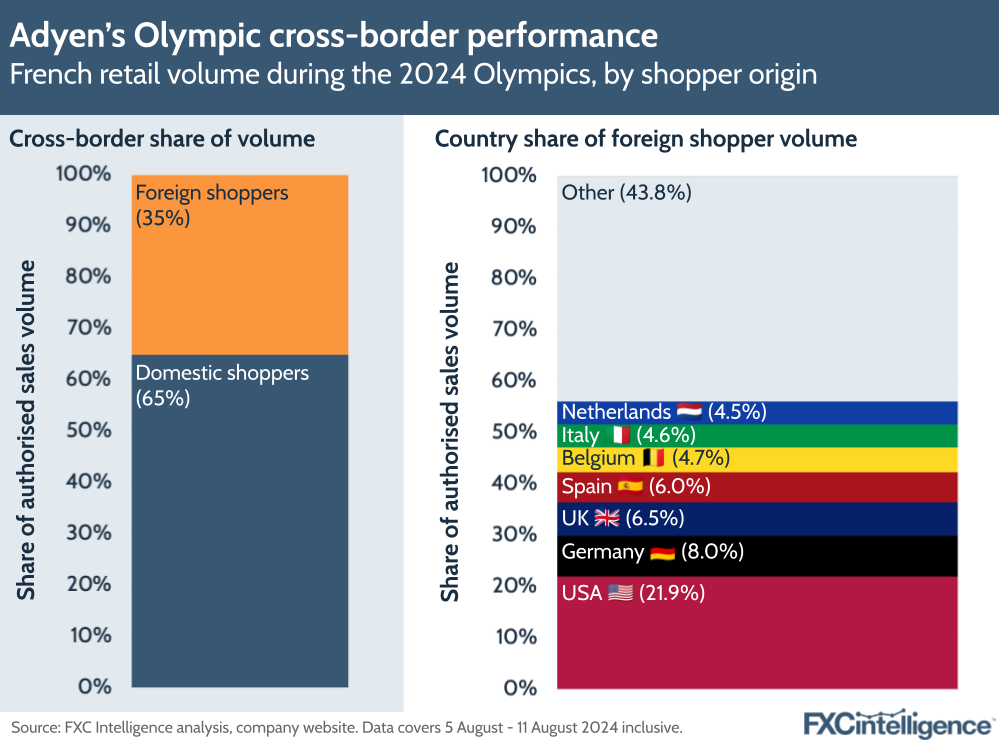
Covering in-person and online payments data, this largely focuses on the company’s Unified Commerce vertical, and shows that during this period, foreign shoppers accounted for 35% of all of Adyen’s authorised sales volume in France.
Within this, shoppers from the US were the biggest contributors, accounting for around 22% of all authorised sales volume of foreign spend over the period, with Germany in second and the UK in third.
In a demonstration of the company’s dynamic currency conversion feature, where this was enabled, Adyen reports that 25% of shoppers from the US opted to pay in dollars.
This data provides an insight into cross-border share of volume for the company, however it is extremely unlikely to be representative of the share in general for two reasons. First, it largely focuses on the Unified Commerce segment, which has a higher mix of PoS than other segments and so will not be representative of the company as a whole.
Secondly, and more significantly, it is a snapshot from a time and place where cross-border purchases are likely to have been extremely elevated, particularly on the point-of-sale side, due to the unusually high number of foreign visitors in France during the Olympics. The high volume of tourists attracted to France in any given summer would make a snapshot of the country in August not representative of Adyen’s volumes as a whole during any period, but during the event this will have been particularly pronounced.
How much of Adyen’s payments volume is cross-border?
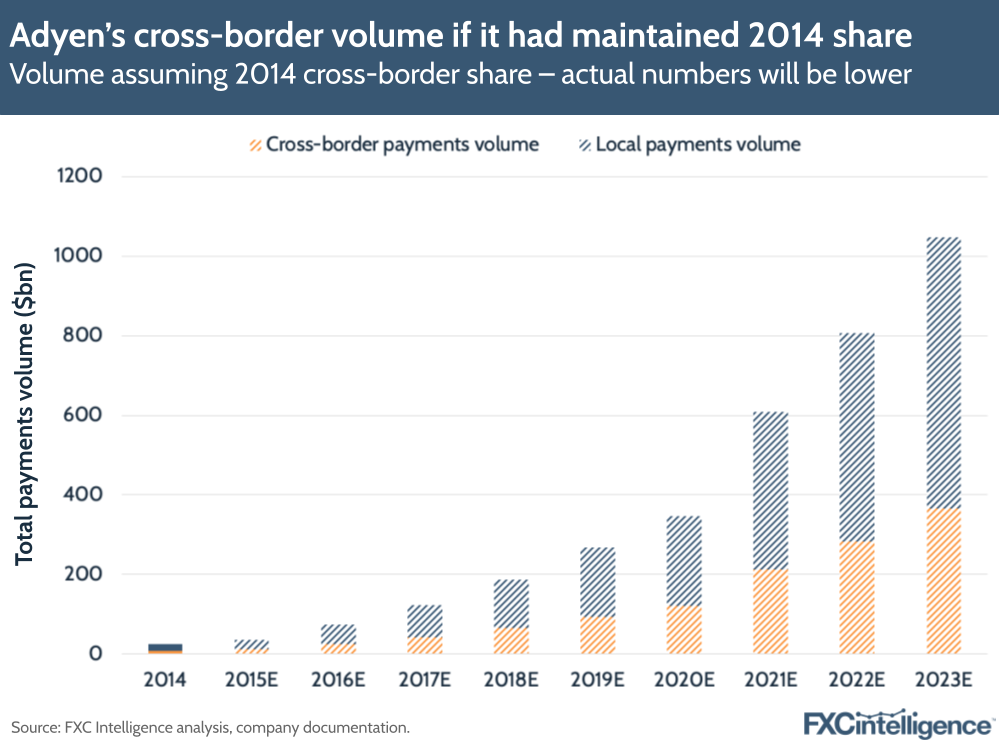
While today Adyen does not report its cross-border payments share, we were able to find data for 2014, when the company reported that cross-border payments accounted for 35% of all volumes.
If the same were true today, Adyen would have processed $367bn in cross-border payments volume in 2023, more than 14 times the entire volume it processed in 2014. However, in reality the share is likely to be lower.
At the time, the Digital segment accounted for the vast majority of the company’s volume and the company handled extremely little point-of-sale volume relative to today. However, the segments that have taken a greater share in the following years include a larger number of companies selling physical goods online, which are less likely to purchased cross-border than their virtual counterparts, as well as a greater share of PoS.
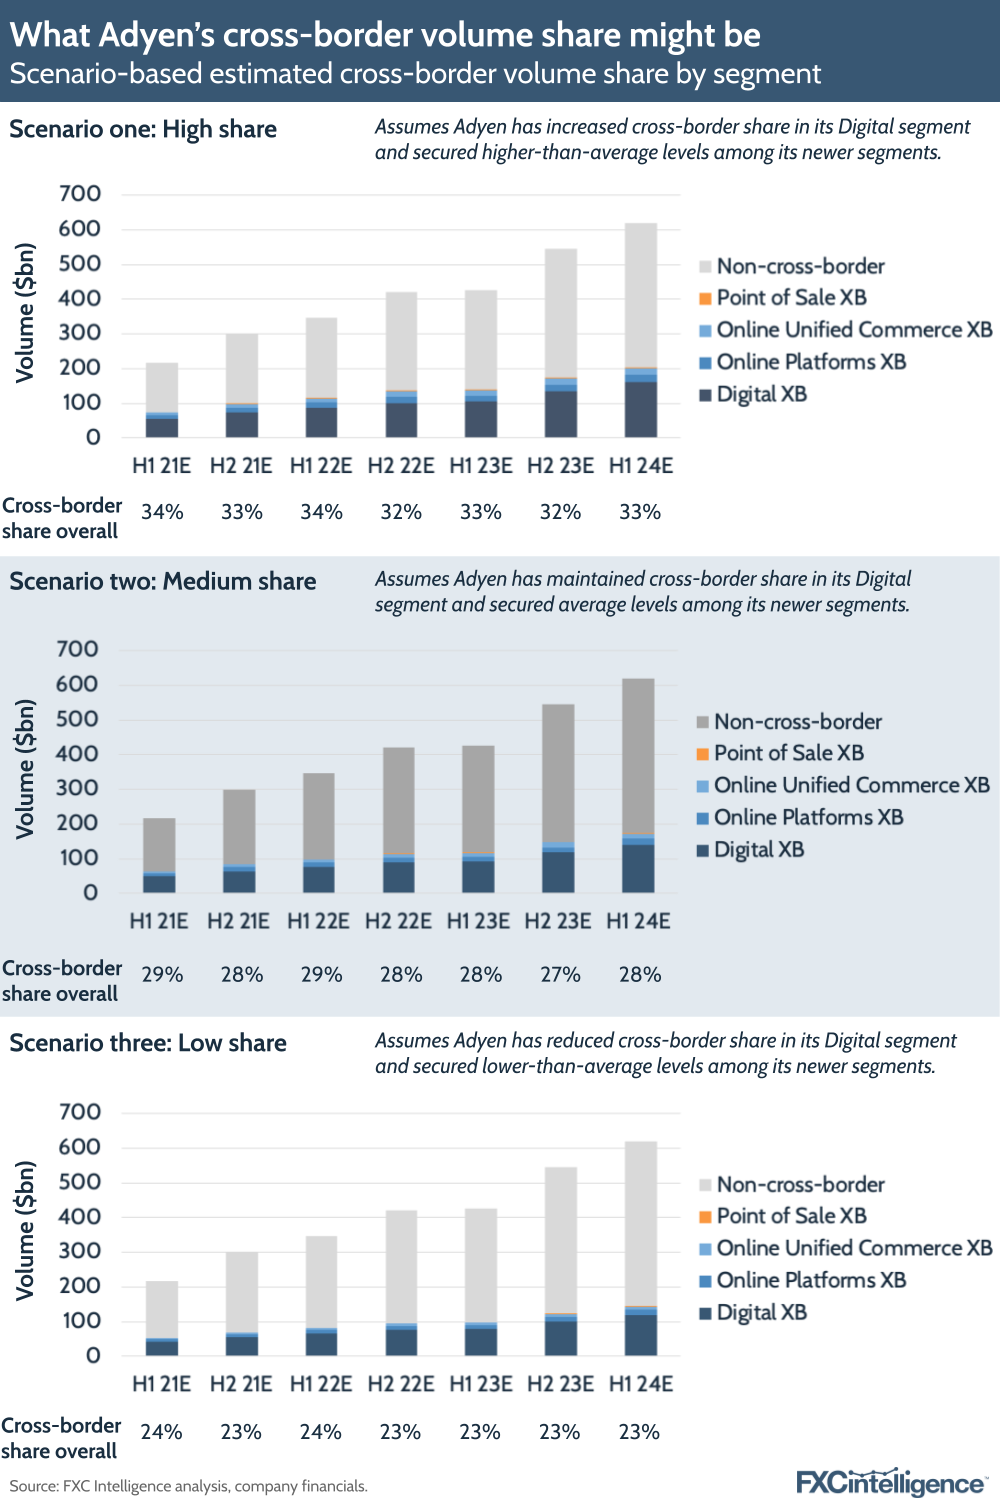
While we cannot say for certain what Adyen’s current cross-border payments volume share is, we were able to model some potentials by considering how the share may differ across different parts of the company. In doing this, we assumed PoS volume would have a very low share of cross-border transactions, while Digital would remain relatively close to the levels reported a decade ago. For Unified Commerce and Platforms, meanwhile, we looked at data reported by similar companies, working on the assumption that Unified Commerce would have a slightly lower cross-border share than Platforms due to the differing nature of the businesses each segment serves.
With this approach, we modelled three scenarios. The first treats Adyen as a company that is attracting a higher-than-average rate of cross-border shopping due to its global focus. Under this scenario, we assumed that Adyen had slightly increased its cross-border share in its Digital segment from its 2014 levels, and that it has secured higher-than-average share among its newer segments.
In the second, we consider the outcome of Adyen remaining on course, assuming that while cross-border has remained the same in Digital, other segments are similar to competitors. Meanwhile, in the third scenario, we look at the possibility that Adyen may be under-performing relative to competitors on cross-border volume, which would see Digital’s share reducing while other segments sit below their competitors.
Under all three scenarios, Digital remains the dominant contributor of cross-border payments volume due to both its size and greater assumed share of cross-border, however the exact ratios vary slightly. Overall in H1 2024, scenario one produced 33% cross-border share, scenario two produced 28% cross-border share and scenario three produced 23% cross-border share.
While Adyen may not explicitly discuss cross-border on a regular basis, the company’s offerings mean that it is baked in at a foundational level, and so does appear to remain a key contributor to the company’s volumes, and therefore revenue.
While it is likely that the company’s share is not as high as it once was, cross-border payments is likely to account for volume in the hundreds of billions of euros for Adyen each year. While the company is increasingly adding to its retail offering, its strong and ongoing presence in the online space, as well as its growth ambitions, are likely to keep it as a major processor of cross-border payments for many years to come.