dLocal has beaten expectations in its latest earnings, posting further increases and prompting a positive investor response. We spoke to CEO Pedro Arnt to find out more about the company’s growth drivers and ongoing emerging markets approach.


Despite mixed results in some areas, emerging-markets-focused dLocal posted a solid Q2 2024, with earnings coming in above analyst expectations and prompting a share price rise.
The company saw revenue increase 6% YoY to $171m, however it faced significant headwinds in some of its markets, particularly from currency devaluation, volatility and some merchant repricing – largely challenges associated with operating in the emerging markets space.
In recognition of the unevenness of revenue growth that this can create, dLocal uses total payment volume (TPV) as its primary metric to track its growth, and here performance was strong. The company saw TPV climb 38% in Q2 2024 to $6bn – growth that sees it compared to a quarter where dLocal had already reported an 80% YoY increase. This TPV growth was attributed to both the addition of new markets as well as increased wallet share from the company’s global merchant base.
However, beneath this, there have been some interesting developments in the share of both TPV and revenue, including across growth in pay-outs, rises in certain verticals and region-specific increases.
We caught up with CEO Pedro Arnt to find out more about the drivers of this quarter’s earnings, as well as to dig further into dLocal’s ongoing strategy.
dLocal’s record total payments volume
Daniel Webber:
You’ve always said that flow is an indication of what you are driving and helping clients with, so let’s start there. Some really strong numbers around TPV: what’s driving that growth in flow this quarter?
Pedro Arnt:
Yeah, record flow for the quarter. We hit $6bn in a quarter for the first time ever. And I think that’s an affirmation that we continue to perform very well on behalf of our merchants.
We saw significant strength across multiple verticals, which I think was also a good sign. It wasn’t that it was really driven by a single merchant or a single vertical.
By and large, we continue to help our global merchants grow their businesses across the Global South and we see that reflected in strong TPV growth across multiple verticals.
DLocal TPV growth driven by key verticals
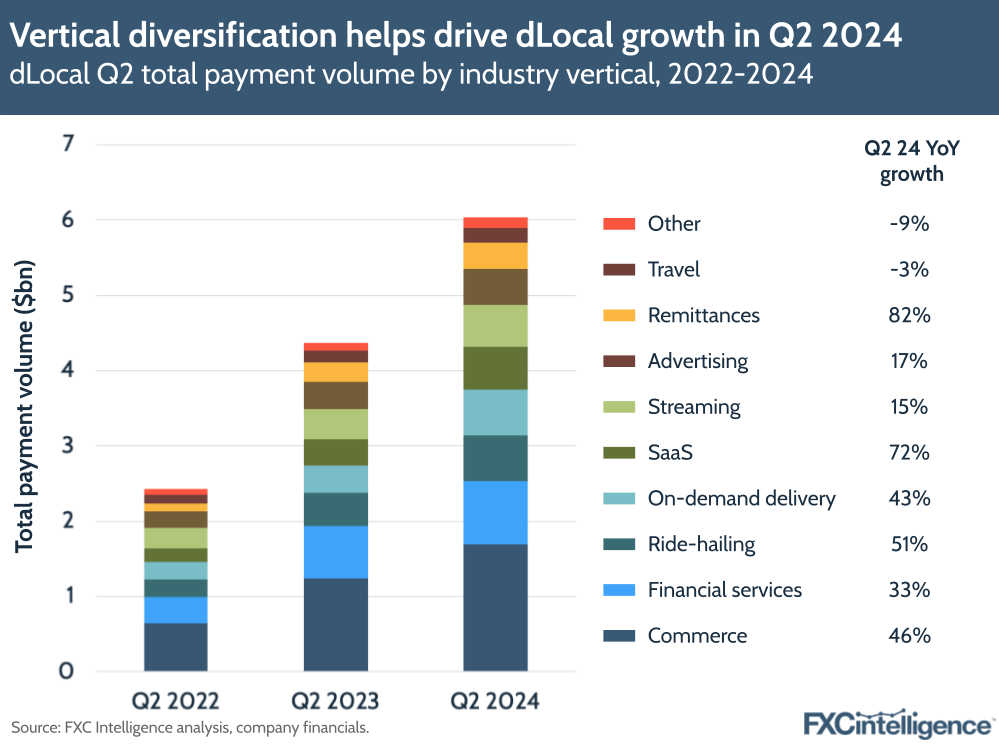
The company’s record TPV was aided by strength in many of the verticals it caters to, with almost all reporting double-digit growth in the quarter. Commerce, the company’s biggest vertical, led the way with growth of 46%, following on from Q1 2024 YoY growth of 195%.
dLocal also cited on-demand delivery (43%), remittances (82%), SaaS (72%) and ride-hailing (51%) as key growth drivers in the quarter. Remittances in particular remains a small part of the company’s TPV at present, at an estimated 6%, but is growing quickly, having also seen 94% growth in Q1 2024.
Travel and Other (which includes e-learning and gaming) were the only two verticals to see a small contraction in the quarter, but both saw growth in Q1 and are the smallest verticals that the company caters to.
In the earnings call, Arnt argued that the sustained and highly diversified TPV growth was a reflection of dLocal’s focus on low-risk, high reputation verticals, which the company has chosen to sustain long-term growth.
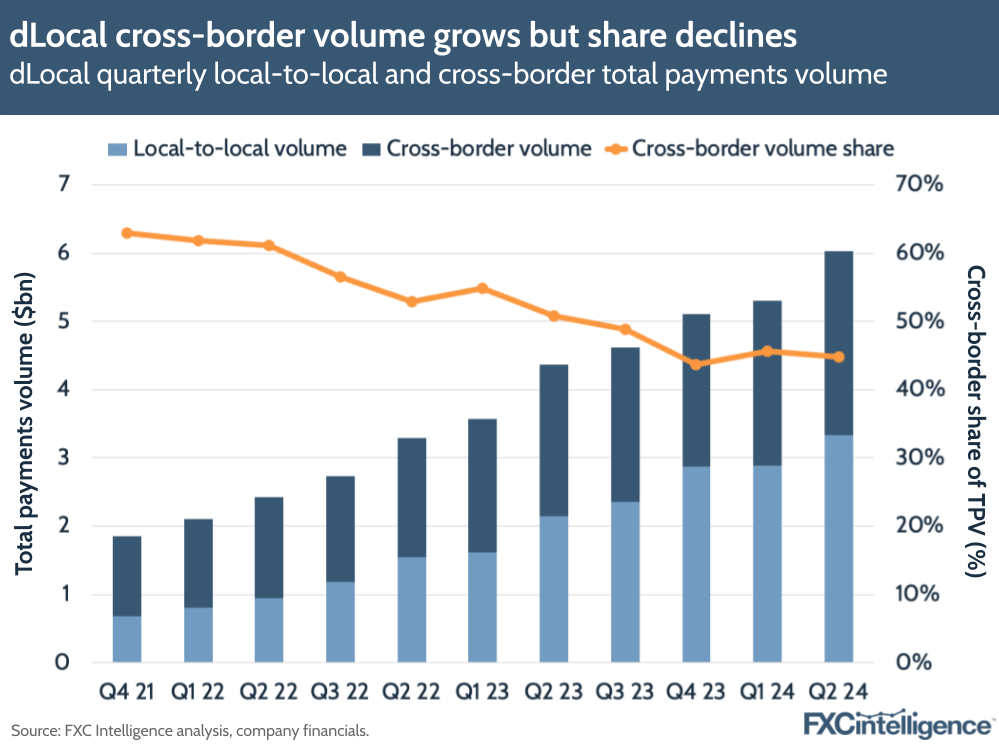
Looking at the split between cross-border and local-to-local payments, both saw strong TPV growth this quarter, although local-to-local is growing at a faster rate and has accounted for more than half of TPV since Q3 2023.
In Q2 2024, cross-border TPV increased 22% YoY to $2.7bn, with much of this growth driven by the company’s ride-hailing vertical, while local-to-local TPV increased 55% to $3.3bn.
Unpacking dLocal’s revenue dynamics in Q2 2024
Daniel Webber:
Your revenue is still growing, but there are different dynamics at play as you grow and evolve your relationships with your clients. Talk us through what is going on there.
Pedro Arnt:
I’ll pair the conversation up looking at gross profit and revenue because I think that’s the more interesting way to do it. If we look at Latin America, we have sequentially – quarter-on-quarter – 11% revenue growth, 10% gross profit growth – really strong sequential growth. If you think about the possibility of compounding that kind of sequential growth over a multi-year period, I think it shows the potential of what we’re building.
Africa and Asia is a very different story and I think revenue is somewhat misleading or perhaps not the metric to focus on. Revenue is very strongly hit by the devaluation of the Egyptian pound and the Nigerian naira. So revenues are actually down significantly QoQ, but when you go to gross profit, you see a sequential growth of 13% QoQ.
That’s because the gross profit metric, in a way, isolates some of the currency dislocations that happen at the revenue level. So, we’re actually quite pleased with the evolution of our Africa and Asia businesses, primarily Africa.
We’ve done a lot of interesting work for global ecommerce merchants in South Africa. We continue to be a very relevant source of liquidity for some very large global players in Egypt. And on the back of the strength there, we saw some really good gross profit and TPV growth quarter-on-quarter throughout Africa.
Currency headwinds create regional challenges for dLocal
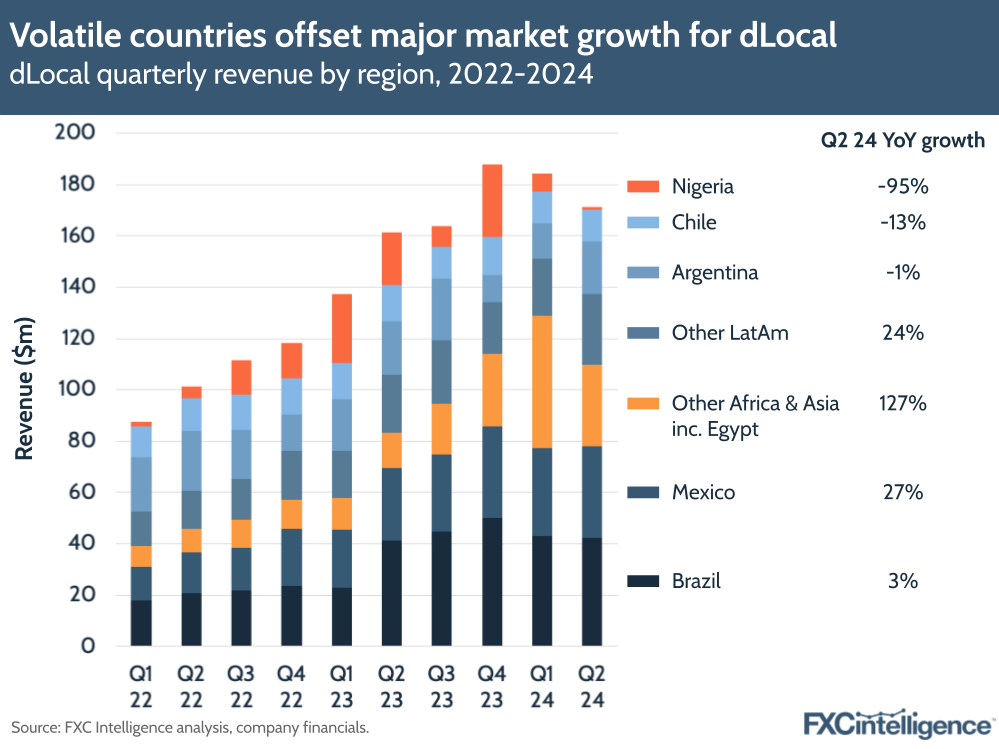
On a regional basis, dLocal saw YoY revenue reductions in some markets in Q2 2024. This was largely driven by material currency devaluations in Nigeria and Egypt, as well as broader weakening across many emerging-market currencies.
Nigeria saw the biggest revenue drop (-95%), driving an overall reduction in the company’s All Africa and Asia segment (-5% YoY). However, this was partially offset by Egypt, which saw revenue more than double, climbing 219% YoY, as well as Other Africa & Asia, which excluding Egypt increased by 79% YoY.
The strength in Egypt also helped drive gross profit for Africa and Asia up by 79% YoY. The company also benefited from the addition of several marquee clients, including a global Chinese fintech, as well as helping several major ecommerce players enter Africa for the first time.
In Latin America, Argentina and Chile both also saw YoY revenue declines of -1% and -13% respectively, while Brazil saw much more muted growth of 3%, following a run of growth of c. 90-115% in the last four quarters.
In this region, only Mexico and Other LatAm saw pronounced growth, of 27% and 24% respectively, although the picture was different for gross profit. While overall Latin America gross profit saw a -13% decline YoY, it did increase by 10% QoQ, with Argentina, Chile and Brazil all seeing QoQ gross profit growth of 48%, 11% and 7% respectively, something that was attributed to increased cost-efficiencies.
Drivers of dLocal’s outsized pay-ins and pay-outs growth
Daniel Webber:
Let’s talk about the two different parts of the business. Your pay-in side – the collection side – is growing incredibly strongly and faster than the underlying market, meaning you’re growing share. What’s been driving that?
Pedro Arnt:
Pay-in is our longer-standing product. It’s therefore the one that’s largest and the strength, as I said, has been quite diversified across multiple categories.
We highlighted very strong growth for the quarter in the software-as-a-service vertical, growing at 72% year-on-year; ride-hailing – the pay-in part of ride-hailing – growing north of 50% year on year; and then commerce – mainly global ecommerce players, but also the on-demand delivery businesses that have become very large in the Global South – both of those growing around 45% year on year.
Those four verticals show the diversification of merchants where we’re seeing very strong growth: all of those have been growing above what the total average for pay-ins has been.
Daniel Webber:
Switching to pay-outs, that’s been growing even faster than the pay-in side. Talk us through the drivers there and what’s been resonating with your clients.
Pedro Arnt:
The pay-outs business has been growing at nearly 50%. One way to think about it is that it’s a combination of where we initially started doing pay-outs, which was typically the pay-out leg for platforms. By that, I mean marketplaces, ride-hailing companies that need to settle to their drivers and global HR platforms or gig economy workers that need to settle payments for the gig economy.
Then, over the last year, we’ve begun to complement that offering – which was really directly servicing global merchants – by offering up this extensive network of payout pipes we have as infrastructure to remittance companies.
That vertical is actually the fastest-growing vertical we have. It’s been growing north of 80% year-on-year as we onboard more and more remittance companies that have the consumer-facing relationship at the originator, or the payer. Then we offer our infrastructure for the FX, the cross-border and the last mile.
Pay-outs take increasing share on significant YoY growth
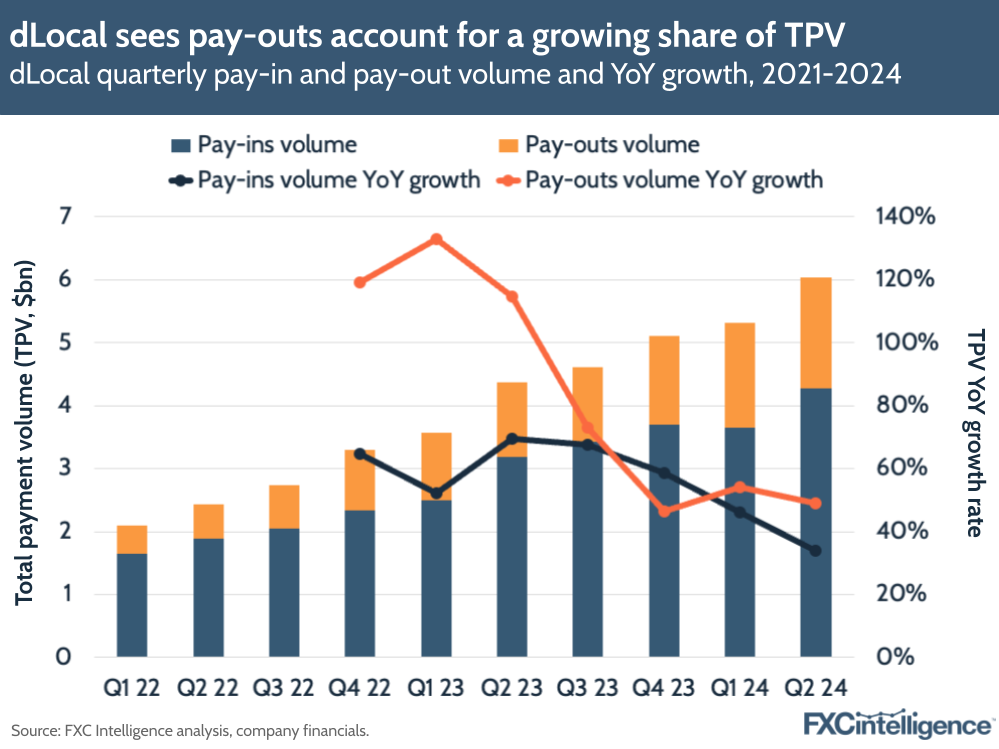
Pay-ins remain the leading form of TPV for dLocal, at $4.3bn in Q2 2024 versus pay-outs’ $1.8bn. However they are growing at a slower rate: pay-ins saw a 34% YoY increase in Q2 2024 while pay-outs increased 49% YoY.
This quarter, pay-outs accounted for 29% of all TPV, compared to 27% in Q2 2023 and 23% in Q2 2022. In Q2, pay-in growth was driven mainly by commerce, on-demand delivery and ride-hailing, while pay-outs were driven by financial services, ride-hailing and SaaS.
Stock buybacks and future strategy
Daniel Webber:
In the earnings call you again mentioned dLocal’s stock buybacks. Talk about your approach there.
Pedro Arnt:
I think that is important. Clearly we feel very strongly about the business.
We’ve acknowledged that when we look at our year-on-year growth, 2023 was a particularly tough comp. In large part, 2023 had some extraordinary results coming from Argentina, with very strong FX results driven by dual currencies. We had a very high-take rate merchant during 2023 that subsequently repriced.
In a way, the way we feel about this is that 2024 somehow reset the base. When we look at the Q2 numbers, that sequential growth indicates that from that reset base in Q1, which was weak and disappointed markets, we’ve shown really strong sequential acceleration.
As a consequence of that confidence in the strength of the business going forward, our capital allocation strategy has deployed significant amounts of capital in buying back our own shares after the pullback that happened at the beginning of this year.
We spent about $100m of our capital over the second quarter and parts of the third quarter buying back our own shares. We trust that over time, that will prove to have been a savvy use of the significant capital we still have on our balance sheet. This business is still very high-margin and very cash-generative.
Profit growth offsets muted revenue
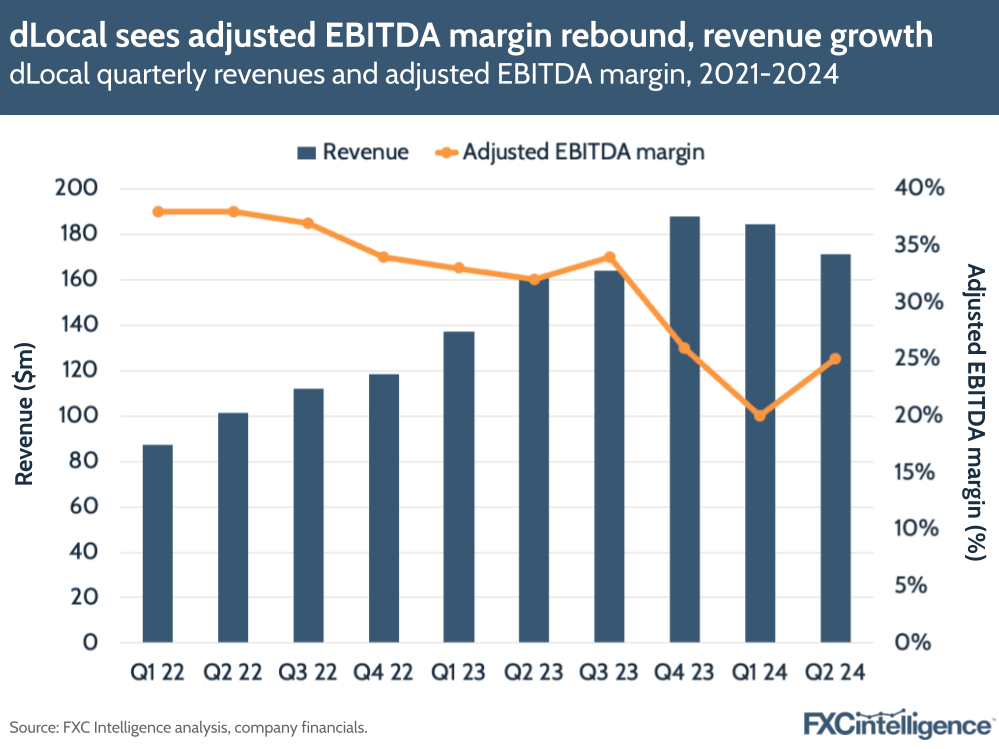
While the company’s revenue growth has slowed, with Q2 2024 seeing it report its first single-digit increase since it went public and is only one of only four quarters where it has reported sub-50% YoY growth, the company did see its adjusted EBITDA margin increase significantly from Q1 2024, although it remains seven percentage points behind its Q2 2023 position.
dLocal has also reduced its FY 2024 guidance in response to its latest earnings. While it does not project revenue, it is now expecting TPV of $24.5bn-26.5bn (previously $25bn-27bn); gross profit of $280m-$300m (previously $320m-$360m); and adjusted EBITDA of $180m-200m (previously $220m-260m).
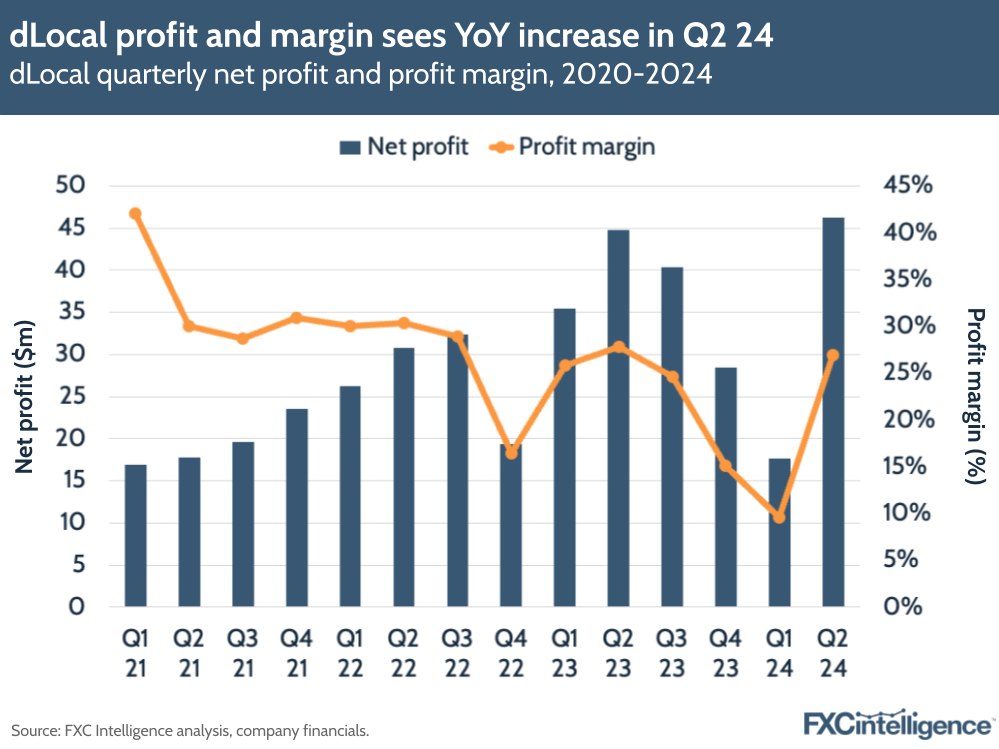
However, despite its headwinds, dLocal saw net profits remaining robust, at $46m – its highest as a public company – for a net profit margin of 27%.
This is despite relatively significant ongoing hiring, with the company seeing a 23% YoY increase in full time-equivalent employees overall, with a 35% increase in Africa and Asia and a 19% increase in the Americas. This was largely driven by hires in technology and product (43% growth) and operations & expansion (23%).
Payments’ take rate declines
Daniel Webber:
Pedro, is there anything else you want to mention that we didn’t cover?
Pedro Arnt:
Part of what many in the payments space struggle with is the structural decline in take rates that payments is facing globally. This is not a dLocal issue: this is an issue across the board. When you look at our take rates sequentially, it came in very, very slightly down. In some aspects almost flat.
That’s important because it shows that it’s not like our take rates are about to have the bottom fall out from them. We still operate across a footprint of over 40 very complex emerging markets, and there is the ability to extract value because we’re solving complex issues for merchants.
So the supposition that the emerging market leaders in this space will have their take rates somehow conflate with your traditional developed market take rate is flat out wrong. This almost flat sequential take rate, on our part, shows how there’s still significant monetisation opportunities from the combination of FX and complexity when you’re focused on the Global South, as we are.
When we look at the second quarter results and we’ve highlighted that Brazil for example, one of our two largest markets, which sequentially grew gross profit by 7%, a lot of that gross profit increase was driven by cost efficiency. Certainly, there is another point which is, yes, our take rates are coming down, but also the networks through which we process are seeing their take rates go down, which means less cost for us.
Then there’s a third wave that will occur soon, which is the increasing shift of volumes away from cards towards alternative payment methods (APMs), which are even lower cost. The Global South has been leading that shift, either through digital wallet adoption in Southeast Asia and parts of Latin America or central bank-sponsored APMs like Pix in Brazil, UPI in India.
We’re seeing a whole wave of new central bank-sponsored payment mechanisms that are being developed throughout Latin America, which I think are very promising for the future with real-time efficient, cheap payments and less reliance on cards.
Daniel Webber:
Pedro, thank you.
Pedro Arnt:
Thank you.
The information provided in this report is for informational purposes only, and does not constitute an offer or solicitation to sell shares or securities. None of the information presented is intended to form the basis for any investment decision, and no specific recommendations are intended. Accordingly, this work and its contents do not constitute investment advice or counsel or solicitation for investment in any security. This report and its contents should not form the basis of, or be relied on in any connection with, any contract or commitment whatsoever. FXC Group Inc. and subsidiaries including FXC Intelligence Ltd expressly disclaims any and all responsibility for any direct or consequential loss or damage of any kind whatsoever arising directly or indirectly from: (i) reliance on any information contained in this report, (ii) any error, omission or inaccuracy in any such information or (iii) any action resulting there from. This report and the data included in this report may not be used for any commercial purpose, used for comparisons by any business in the money transfer or payments space or distributed or sold to any other third parties without the expressed written permission or license granted directly by FXC Intelligence Ltd.