Banks account for the vast majority of B2B cross-border payments, but it can be hard to get clear visibility into their performance in this area. In this new landmark report, we look at the cross-border payments performance and transparency of some of the world’s biggest banks.
It’s commonly stated that no single non-bank player accounts for more a few percentage points of the B2B cross-border payments market, and that isn’t because the industry is short of significant players. Banks’ dominance of the B2B payments market is unparalleled in any other area of cross-border payments, with the vast majority of global business payments sent each year being transmitted via a bank provider.
Of these, much of the world’s B2B payments flows are handled by a relatively small number of players, which generate an immense amount of revenue each year from cross-border payments and related services.
But while the share of the non-bank market may be comparatively small, it is growing quickly, and – if the senior leadership teams running such companies are to be believed – is largely taking share from banks, rather than other non-bank players. For some time, the industry perception has been that banks have been behind non-bank players when it comes to cross-border payments innovation – and that they have been losing customers to non-banks as a result.
In reality, those involved in cross-border payments at many banks have taken significant steps to respond and innovate their offerings. But how much is that filtering through to the banks’ earnings reports and public presentation? And what does it tell us about the prospects of both the banking and non-banking sides of the B2B cross-border payments industry?
In this deep-dive report, we dig into the earnings of 13 different global banks who together are responsible for a significant portion of the world’s B2B cross-border payments flows. These banks – Bank of America, Barclays, BNP Paribas, Citi, Deutsche Bank, Goldman Sachs, HSBC, JPMorgan Chase, NatWest, Societe Generale, Standard Chartered, UBS and Wells Fargo – were selected as some of the world’s biggest banks with strong corporate cross-border payments offerings.
For each bank, we explore how much cross-border payments is represented in their earnings releases, particularly for corporate customers, and where in this business it is present. We also look at how the segments reported have grown, as well as their share of the wider banking groups’ revenues, and consider how each company presents its corporate cross-border payments services online.
This sees us focus specifically on transaction banking for international companies and the cross-border payments services related to these, rather than other cross-border payments-related areas also typically catered to by banks. For example, this report does not include FX and currency trading, which is typically reported separately under banks’ markets and trading divisions.
In some cases banks also have retail payments processing services, which may be reported as part of transaction banking services. We have not included these where they are reported separately, and have noted their inclusion where they form part of a broader reporting segment that is relevant to this report.
Most of the banks covered in this report also have retail and consumer cross-border payments offerings, although these are typically not broken out and are often covered by different segments to transaction banking. As a result, while we may briefly cover these in the individual analysis for certain banks, this is not a focus of this report and is not included in our comparative analysis.
While many players may have a role in the delivery of cross-border payments between businesses, our focus here is on payments where the bank has a direct relationship with the customer, rather than where they are delivering payments as part of a white-label partnership or similar.
Banks’ significance in cross-border payments
While the presence of non-bank cross-border payments has grown over the years, as it stands, banks still account for the vast majority of flows in B2B cross-border payments.
According to FXC Intelligence Market Sizing Data, in 2023 the entire B2B cross-border payments market, which covers B2B payments directly handled by companies rather than additional processors or intermediaries, saw total flows of $30.2tn globally. However, $27.8tn of this was handled by banks – a 92% share of the overall flows.
The remaining non-bank players saw combined flows of $2.4tn in 2023 – still a significant market opportunity, but dwarfed by the amounts handled by the banking sector. Our data also indicates that non bank players’ 8% share represents an improvement on previous years, meaning it is taking share from banks.
Given that the B2B cross-border payments sector is set to be worth $50tn by 2032, the opportunity for banks is significant, but so too is that for non-bank players.
Within the 2030 metrics, the split of the types of companies also provides some insights. Across the total, $10tn were flows from small and medium-sized (SME) companies, which accounted for 33%. The remaining 67% – $20.2tn – was made up of flows from larger businesses, referred to here as corporate.
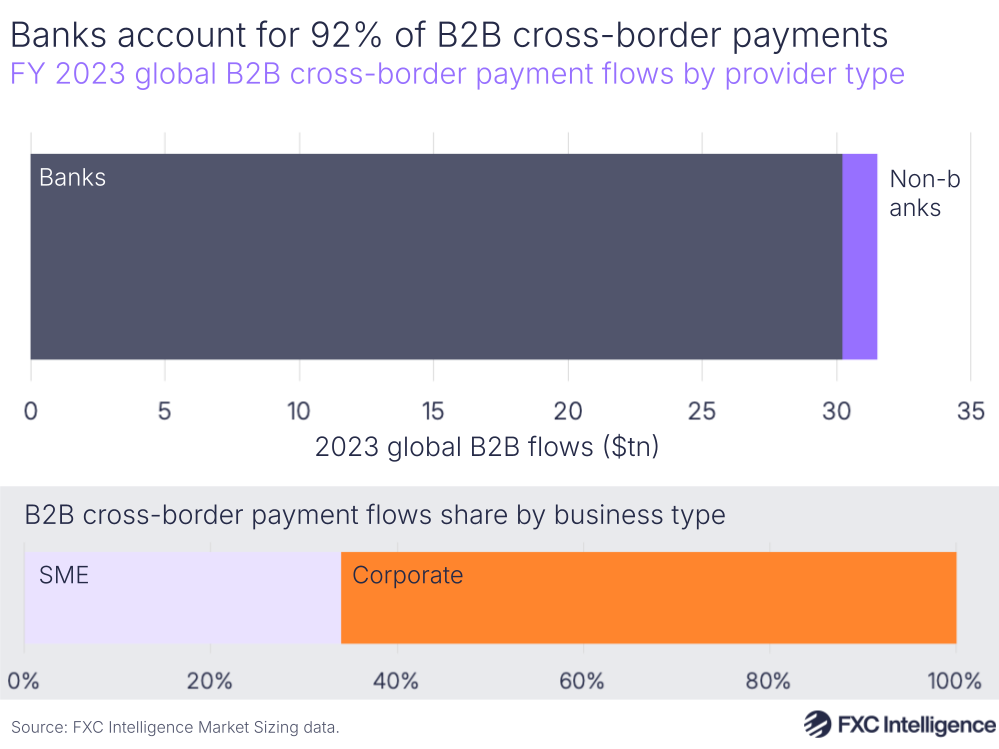
On the B2B side, the distinction between SME and corporate businesses is key because these two types of businesses have very different cross-border needs. On the SME side, this will largely be made up of very large numbers of small businesses who each send small numbers of cross-border payments. In general such businesses need fairly simple cross-border offerings and will typically value qualities such as cost and ease of access. As a result, these types of businesses will often be provided with services that are closer to consumer cross-border payments than their corporate alternatives.
Larger corporations and enterprises, on the other hand, will typically send far greater amounts and will often require a wide array of more complex solutions surrounding the payment itself, including solutions related to FX risk management and hedging, as well as areas such as trade finance and liquidity.
These more complex products create more opportunities for revenue generation and so for banks are typically a much greater focus of products and services, which is also generally reflected in how banks both promote their cross-border solutions and report them as part of their earnings.
Interestingly, we found that non-banks had a greater share of B2B cross-border payments when looking at SME flows alone. Here, 24% of such flows were handled by non-bank providers in 2023, while banks accounted for 76%.
The B2B payments market is one part of a broader landscape of cross-border payments flows, some of which banks also handle. This includes consumer-to-consumer payments and those between consumers and businesses. It also includes wholesale payments between organisations such as financial services groups, governments and investment firms, which covers transactions for currency trading and related activities.
The wholesale cross-border payments market is larger than the overall non-wholesale cross-border payments market, which includes both B2B and consumer-led payments. FXC Intelligence projects that the non-wholesale cross-border payments market will total $65tn in 2030, with B2B payments accounting for around 86%, while wholesale cross-border payments will reach $225tn.
How is banks’ share of the global B2B payments market set to change?
How cross-border payments is reported within banks’ operations
Cross-border payments is not a common segmentation for the vast majority of banks when it comes to financial reporting, meaning this report required deep analysis of the companies’ reporting structures in order to determine where they sat within wider business units.
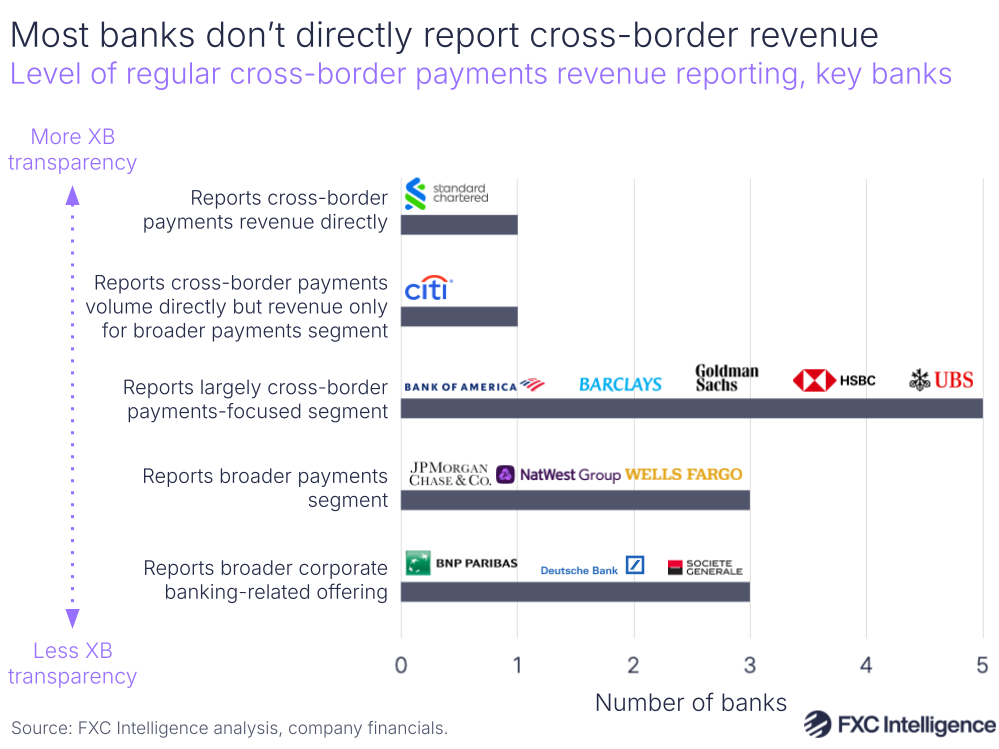
Out of the 13 different banks we reviewed for this report, only one – Standard Chartered – directly reported cross-border payments revenue, and only did so in H2 and FY reporting.
Citi does not report cross-border revenue, although it does regularly report the cross-border flows for its Payments division – the only bank out of those assessed to provide such data regularly.
Five out of the 13 – Bank of America, Barclays, Goldman Sachs, HSBC and UBS – report revenue for a segment that is not exclusively cross-border payments, but in which the service plays a major part, such as transaction banking or similar.
Three more – JPMorgan Chase, NatWest and Wells Fargo – reported similar revenue for a payments division that included cross-border payments, but where domestic payments and other related services such as payments processing also played a significant role. Citi also falls into this category for revenue reporting alone.
The final three – BNP Paribas, Deutsche Bank and Societe Generale – report revenue only for a wider corporate banking-focused business unit where cross-border payments is one of a variety of services and where the revenue split within this is unclear.
Five of the 13 banks – Barclays, JPMorgan Chase, Standard Chartered, Societe Generale and Wells Fargo – also report such revenue as part of a wider unit that includes investment banking, while the remaining eight have investment banking as a completely separate division.
Investment banking is a very different type of business to payments, however does typically include areas such as FX where there is some potential for overlap with cross-border payments reporting. In banks where this is the case, we have clarified the segments and attempted to break out lines that do not include investment-related FX and similar wherever possible.
What corporate cross-border payments offerings do banks promote?
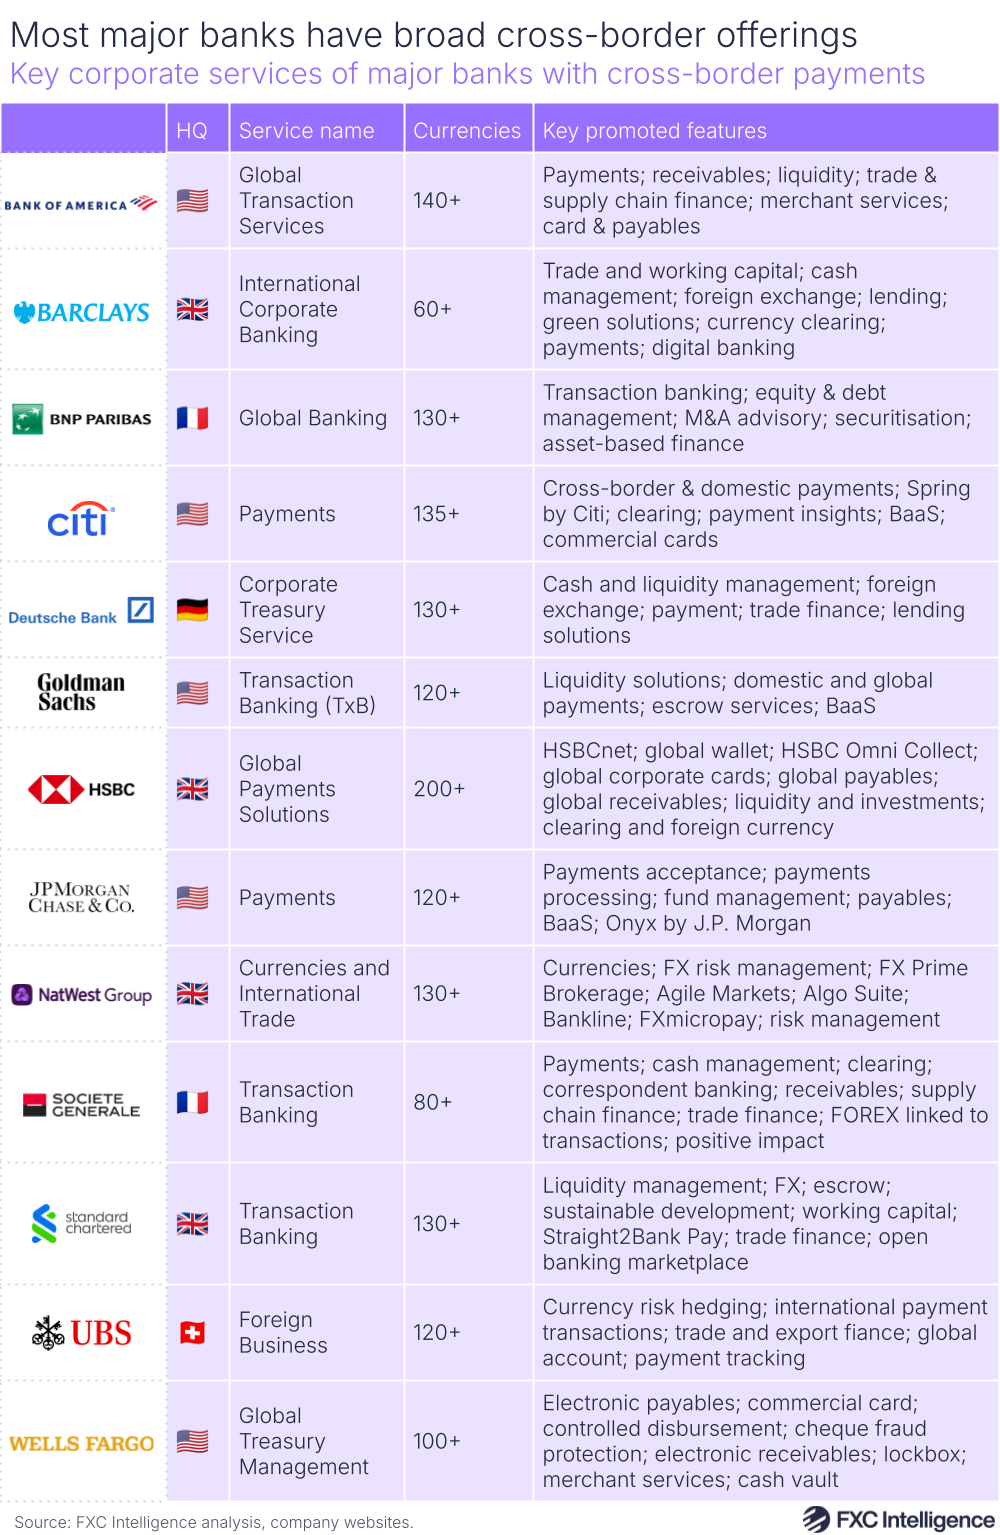
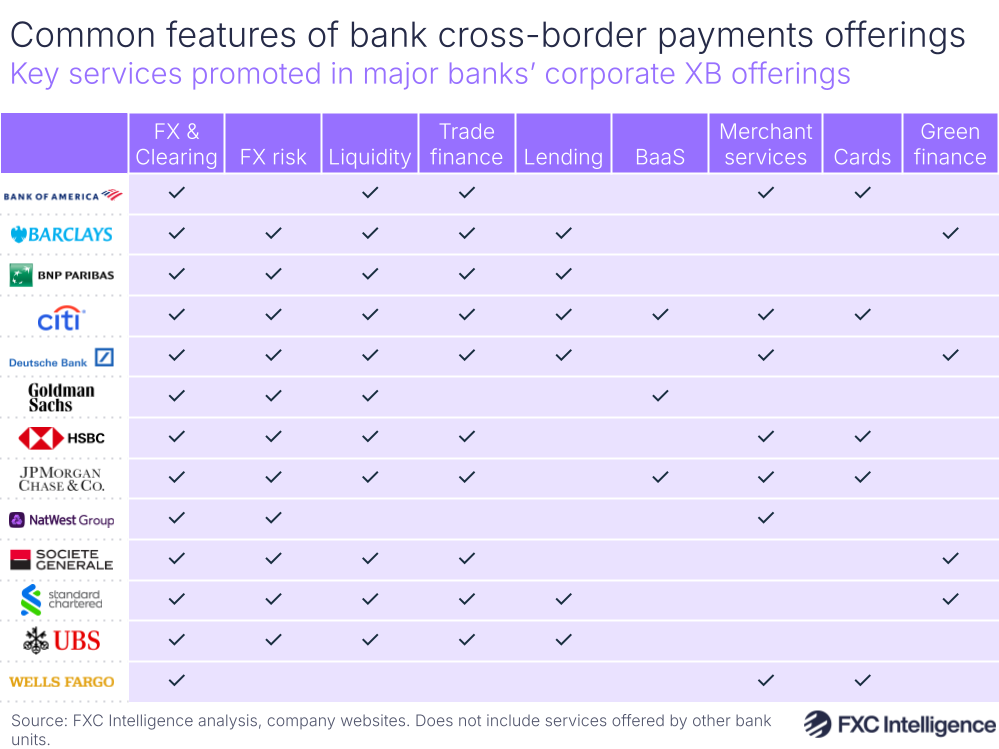
Reviewing the publicly presented offerings on the 13 banks’ websites shows that while there are some common services consistently provided as part of cross-border payment offerings, there is also relatively significant variation in how companies discuss their services in this area.
The precise size of business clients catered to by each bank varies slightly, although all are serving customers larger than SMEs, as does the terminology. For the purpose of this report we will use the term corporate to refer to these clients, which are for the most part larger than commercial clients, as an overall group. Individual banks in some cases break out their clients in more detail, which we cover in our bank-by-bank analysis.
The most common way to frame corporate cross-border payments service was as part of a transaction banking service, with Goldman Sachs, Societe Generale and Bank of America among those who take this approach. This generally sees payment services at the core of the offering, although typically also involves related services, including trade, supply chain and liquidity-related solutions.
Some also framed their cross-border payments services as part of a broader payments offering, with Citi and J.P. Morgan among those who take this approach. Here domestic payments typically play a greater role alongside cross-border payments, while additional ecommerce-related payments processing services are also common, as well as broader banking-as-a-service (BaaS) solutions.
The remaining companies typically presented cross-border payments as part of a wider suite of international corporate banking solutions, featuring broader services alongside those related to global payments and trade. BNP Paribas, for example, promotes its M&A advisory services and equity and debt management solutions alongside its transaction banking solutions.
Reviewing what services were promoted as part of core web pages discussing corporate cross-border payments offerings identified some common trends and outliers in alignment with this, though it should be noted that what these banks say they offer on their websites is unlikely to include all their offerings and large corporate clients would not always be expected to review a website to understand offerings.
We found that while there were some common services offered by all 13 banks, including payables, receivables, FX and clearing, there were some services that only a small number of banks promoted alongside cross-border solutions for corporate clients. Note that this does not mean that such services are not offered by the bank in question, but that the services are not promoted or offered as part of cross-border-related web pages and may be handled by a different unit or division entirely.
Almost all banks on the list, apart from NatWest and Wells Fargo, discussed liquidity as part of their solutions. Notably, both these two had pages that were addressed to a slightly smaller business size than some of the others, which were framed more at multinational companies; this may explain the pair’s slightly narrower range of offerings.
FX risk solutions, including services such as currency hedging, were mentioned by all banks except Bank of America and Wells Fargo.
Some services were generally split more by how banks were choosing to discuss their products. Highly payments or transaction banking-focused pages such as Goldman Sachs, HSBC and J.P. Morgan were less likely to feature lending solutions, although they will certainly have these offered in other parts of their websites.
Cards was also interesting in that less than half of the banks featured these on cross-border-related pages, despite global card solutions becoming an increasingly popular offering across non-bank cross-border payments solutions. A small number, namely J.P. Morgan and Standard Chartered, also discussed their use of blockchain technology in their products, with the former promoting its asset tokenisation platform Onyx by J.P. Morgan, while the latter discussed its blockchain-based digital trade finance platform.
Some larger and more globally focused players also promoted their sustainable finance-related solutions, although this was notably refined only to banks headquartered in the UK, France and Germany – suggesting that this is something European companies are more interested in than their North American counterparts.
Finally, many banks also made reference to transparency and tracking solutions, as well as digital platforms and real-time delivery. This is likely a reflection of the growing expectations around the B2B cross-border payments space, where users are increasingly asking for services that are similar to those offered on the consumer side, and which non-bank players are increasingly stepping up to.
How do bank’s payment capabilities compare to non-bank players on each corridor?
How much can we compare banks’ cross-border contributions?
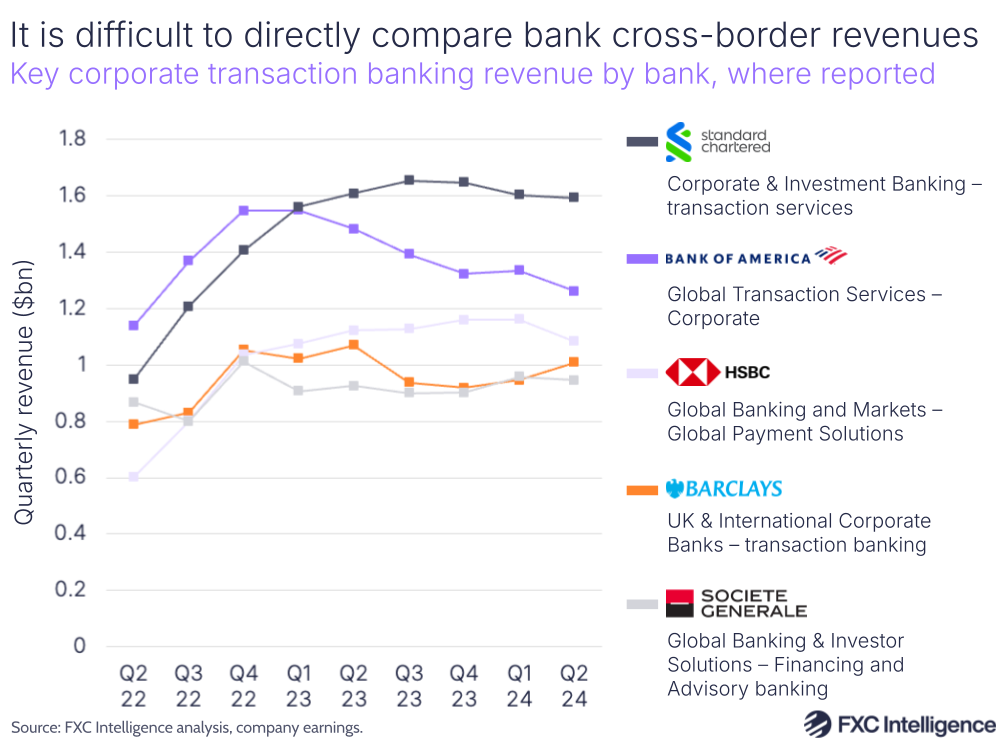
The broad range of ways that different banks break out their cross-border payments revenue makes direct comparisons at best highly challenging and at worst unviable. While it is not possible to reliably compare the cross-border payments revenue for all 13 banks reviewed in this report directly, the reported transaction banking revenue of some of the companies can be roughly compared.
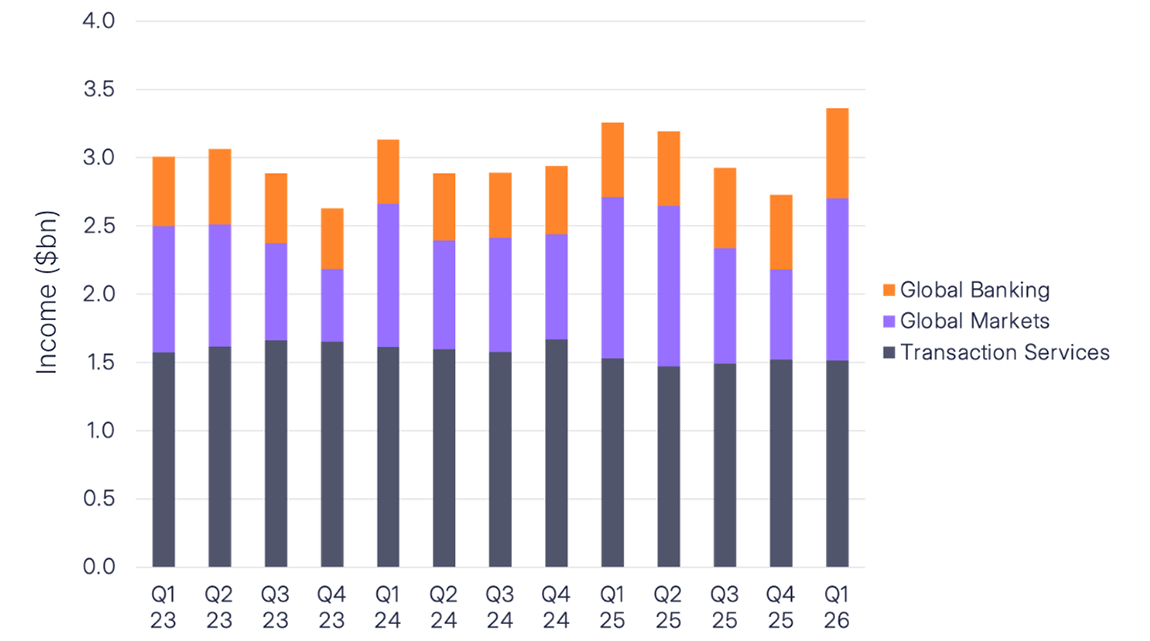
Looking at the reported corporate transaction banking revenue of Standard Chartered, Bank of America, HSBC, Barclays and Societe Generale over time shows HSBC, Barclays and Societe Generale reporting fairly similar results each quarter, although HSBC has pulled ahead slightly over the past year.
However, while Bank of America was leading this group on transaction banking revenue, Standard Chartered pulled ahead in mid-2023 and has remained consistently in the lead since. While almost all players saw a revenue jump in H2 2022, this saw both Bank of America and Standard Chartered pull ahead considerably during this period and into H1 2023. H2 2023 and H1 2024 have been flatter for most, with both Barclays and Bank of America seeing more uneven performance during this period.
Some of this movement may be the result of a changing interest environment, with interest revenue being a consistent factor for many of the banks’ earnings over this period. However, there are also indications of underlying differences in performance, which may reflect greater and lesser success in engaging and sustaining global client bases.
Looking solely at the growth rates for all 13 banks’ key cross-border related segments, there is a similar interest-led trend: most of those assessed saw stronger growth across FY 2023 while several had subsequent declines in H1 2024 and Q2 2024.
For some, including J.P. Morgan, company-specific factors such as acquisitions have impacted growth rates and in particular made them more pronounced, while for others, most notably Goldman Sachs, restructures have made YoY comparisons more challenging. Such factors are discussed in more detail in the individual bank breakdowns below.
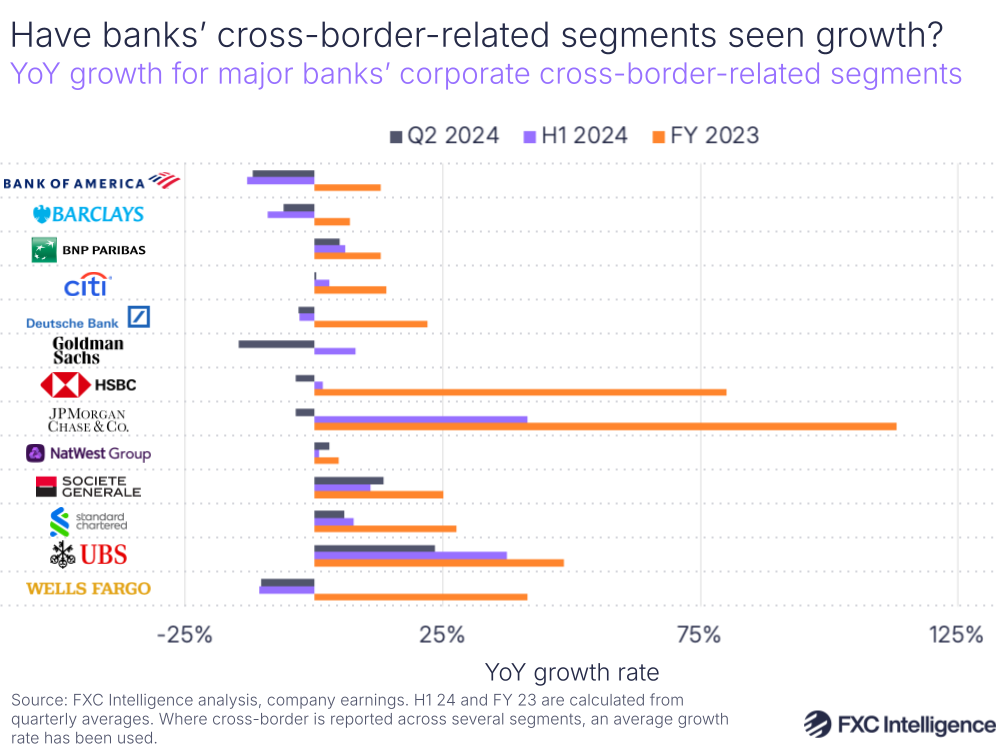
These growth rates are interesting to compare with non-bank B2B payments players. For example, Corpay’s Corporate Payments division saw FY 2023 growth of 27% and Q2 and H1 2024 growth of 17%, putting it at the higher end of the banks. OFX’s corporate offering, meanwhile, saw 5% YoY revenue growth in FY 2024 (equivalent to Q2 23-Q1 24), while its enterprise offering saw 33% YoY revenue growth.
How much are banks talking about cross-border payments?
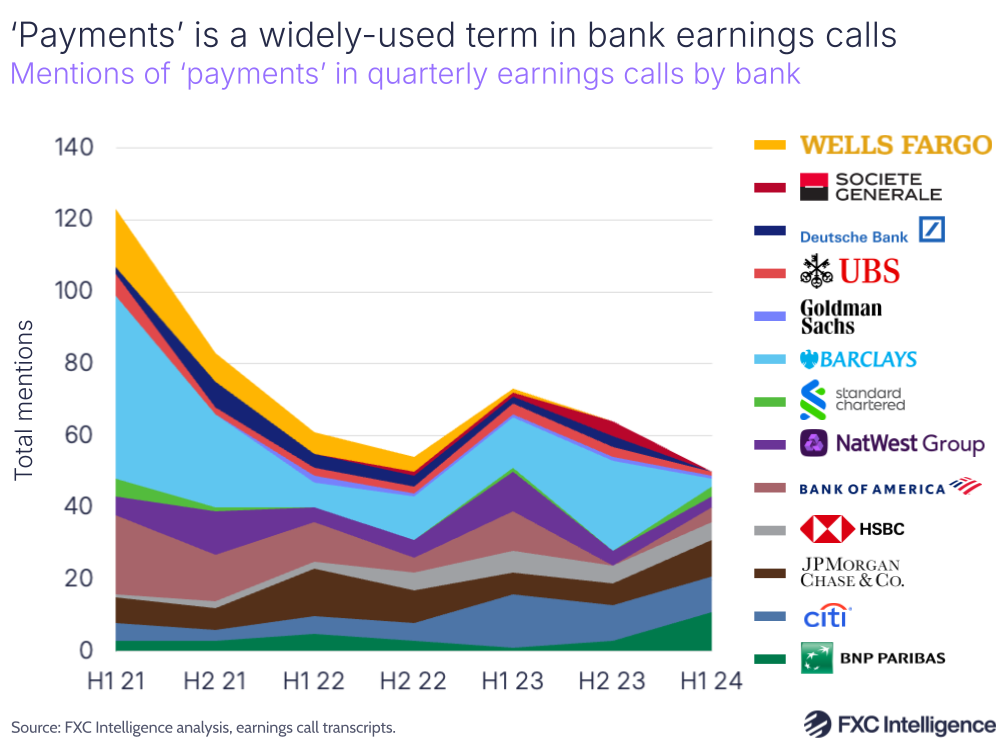
The level of discussion of cross-border payments and related terms in bank’s earnings calls is also highly illuminating in determining how much the overall groups are seeing the area as key to their businesses.
Our analysis of the frequency of terms within earnings calls found that all banks used the term ‘payments’ in multiple earnings calls between Q1 2021 and Q2 2024, although some referenced payments more than others. Citi, J.P. Morgan and NatWest used the term in every call, while Goldman Sachs, Societe Generale and Standard Chartered only used it occasionally.
Barclays used the term the most – a total of 137 times across all earnings calls – followed by JPMorgan (57 times) and Citi (53), while Goldman Sachs and Societe Generale used it the joint least, at six times each.
However, the term payments alone may be referring to multiple different things within a given bank’s earnings call, and analysis of the use of the term ‘cross-border’ is more illuminating.
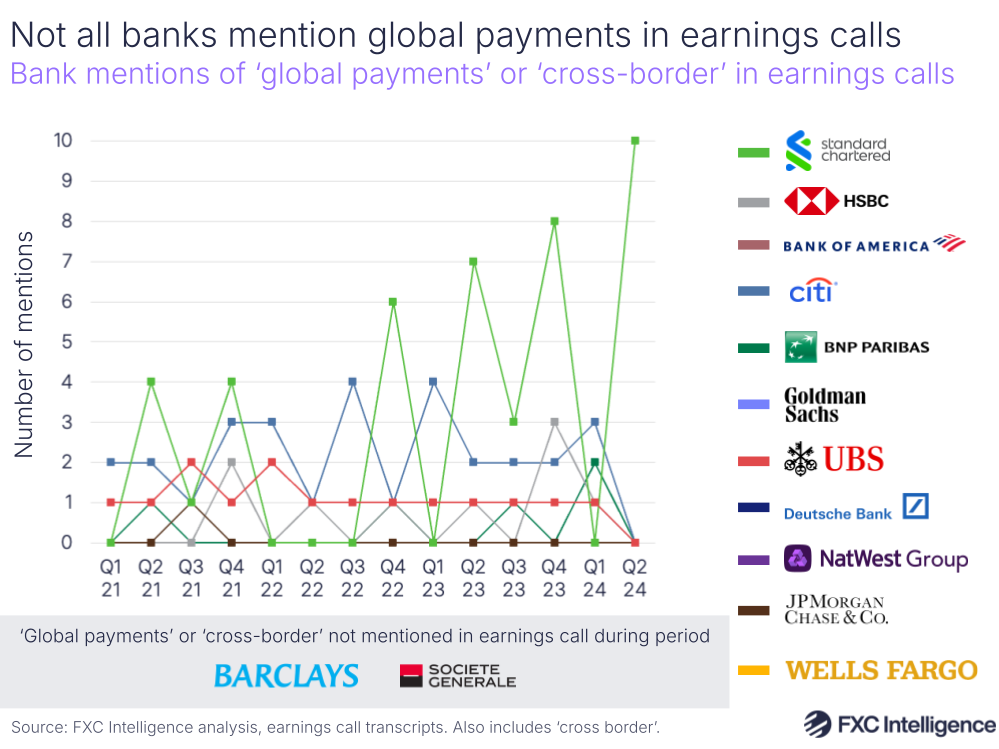
Here, seven of the 13 banks (54%) did not mention the term once in any earnings call during the period and of those that did, Standard Chartered mentioned it the most – in all but one call, for a total of 43 times. Citi had the second-most mentions, also using the term ‘cross-border’ in all but one call for a total of 30 mentions.
The broader term ‘cross-border payments’ saw more limited discussion, netting a total of 10 mentions across all 13 banks’ 14 earnings call periods. The majority of these were from Citi (5) and Standard Chartered (3), with the remaining single mentions coming from BNP Paribas and HSBC.
Use of the phrase ‘cross-border flows’ was also exclusive to Citi and Standard Chartered.
The term ‘global payments’ was slightly more widely used, seeing 20 mentions across all the banks for the period, with 7 of the 13 using the term at least once. HSBC was by far the most common user of the term, at 12 mentions across 7 earnings calls, although this is likely the result of one of its segments using the term as its name.
Other terms including ‘international payments’ had no mentions at all, while terms such as ‘send money’ and ‘remittances’ were only used occasionally by a small number of banks.
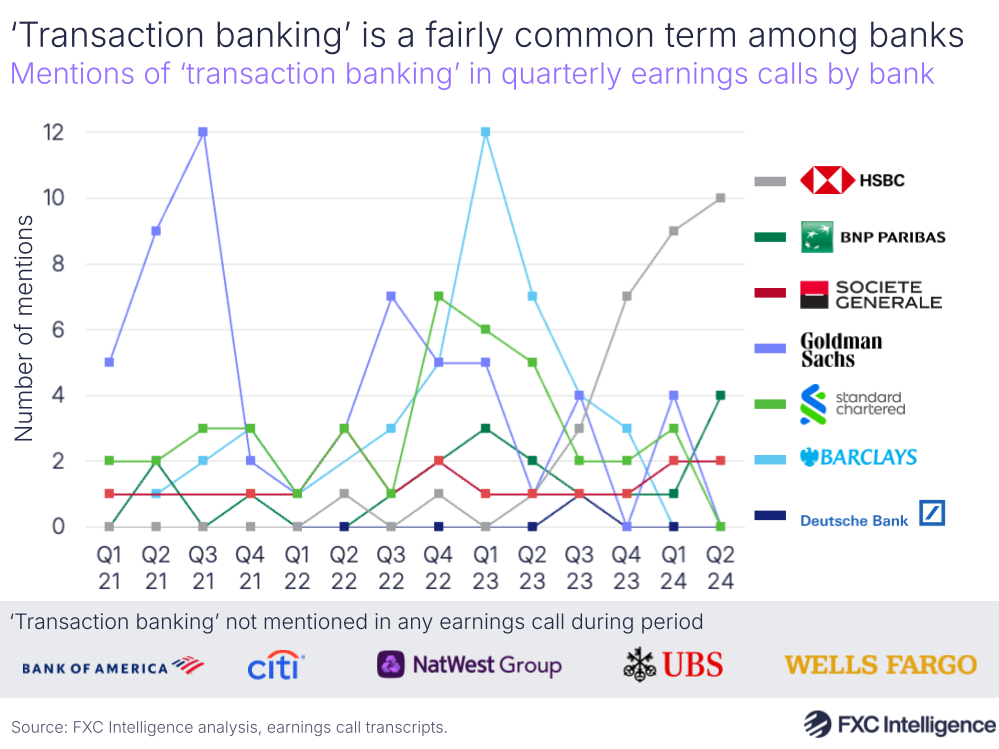
Use of the term ‘transaction banking’ was more common, however, with 7 of the 13 banks using the term at least once, and mentions overall totalling 208 across the period. Only Societe Generale mentioned the term in every call, however its total usage across the period (40) fell behind both Barclays (42) and Goldman Sachs (58).
The term FX was also very commonly used, with a total of 505 mentions by all banks, all of which used the term at least once. Deutsche Bank was the most common user of the term, mentioning it in every call for a total of 144 times, while UBS used it 116 times.
Get in touch to find out how we can support your cross-border payments strategy
Cross-border payments by individual bank
While most of the banks looked at for this report do not go into explicit detail about the revenue they earn from their cross-border payments products alone, there are insights to be found from all of their earnings. Here we review the latest and historical financial reports of all 13 banks to see how cross-border payments is developing within their businesses and contributing to their bottom lines.
Bank of America
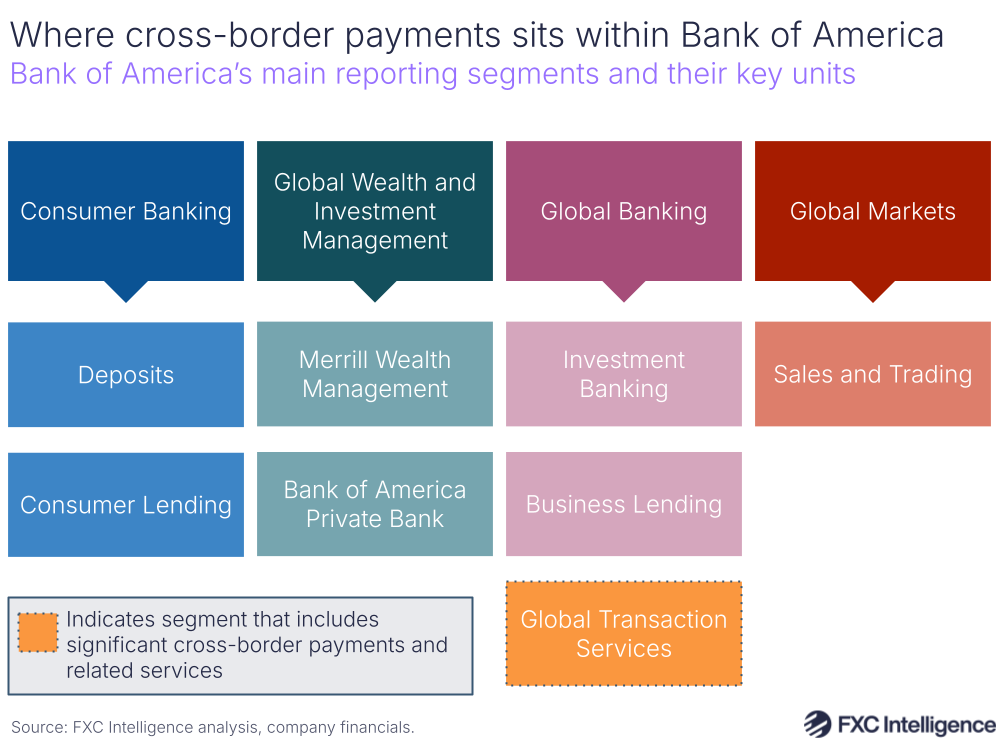
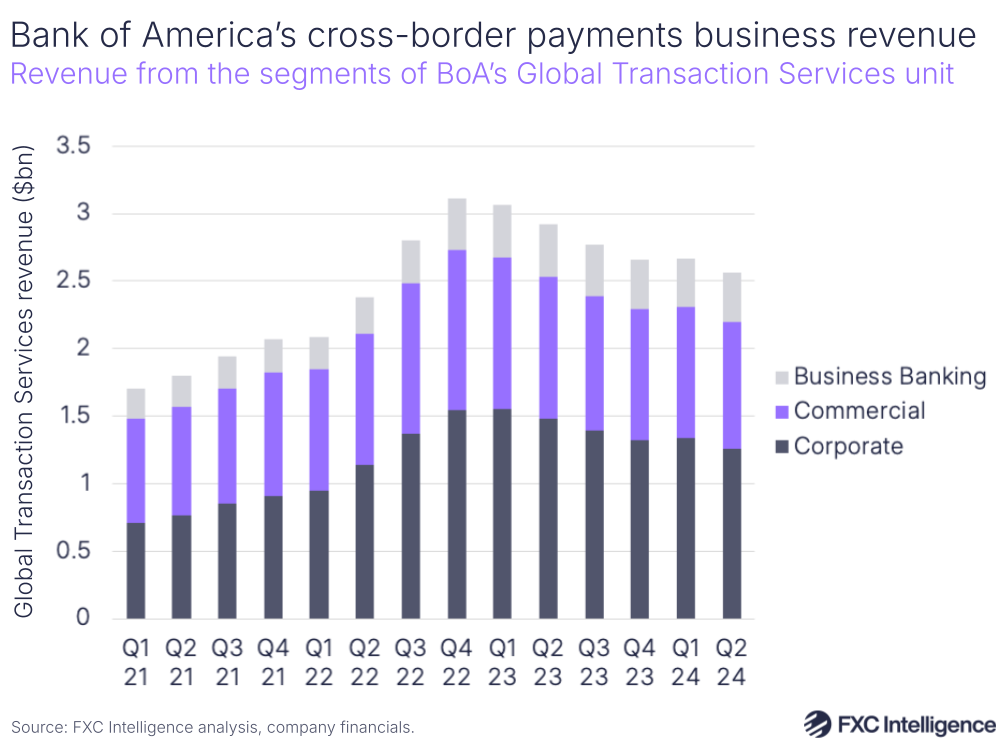
Bank of America (BoA) is one of the banks looked at in this report that breaks out revenue from a segment largely focused on cross-border payments and related services within its regular reporting. It does this through its Global Transaction Services unit, which forms one of three key parts of BoA’s Global Banking segment – itself one of four of the bank’s top-level segments.
Covering services including B2B and B2C domestic payments, receivables, merchant services and cards, the company’s Global Transaction Services includes some domestic payments, but places a significant focus on cross-border solutions. It enables businesses and institutions to handle such services via Bank of America’s digital banking platform CashPro, which is accessible via mobile and desktop, as well as through file transmissions and API.
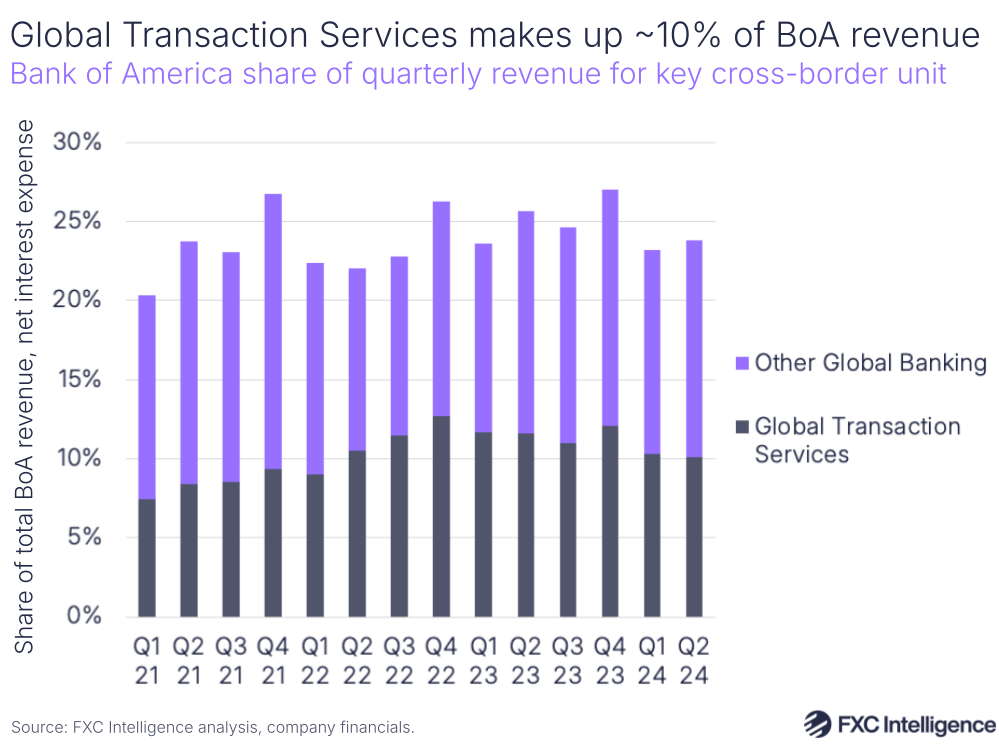
As of Q2 2024, Global Transaction Services represented 42% of the revenue generated by the company’s Global Banking segment and 10% of all revenue generated by Bank of America, net of interest expense. However, this is a lower share than it has previously taken.
Between Q2 2022 and Q2 2023, Global Transaction Services averaged almost half of Global Banking’s revenue, peaking at 50.1% in Q3 2022, and saw its share of all BoA revenue peak at 12.7% in Q4 2022.
Global Transaction Services revenue is split into three customer segments: Corporate, Commercial and Business Banking. Corporate is the largest, having accounted for around half of Global Transaction Services revenue every quarter since the start of 2023, while Commercial accounts for slightly over a quarter, at 37% in Q2 2024. Business Banking, meanwhile, is the smallest, accounting for 14% in Q2 2024.
However, all three have seen YoY reductions in revenue for the past three quarters, with Commercial and Business Banking both having seen reductions for four quarters. In the latest quarter, Corporate saw the biggest YoY drop, reducing by -15% YoY, while Commercial contracted by -10% and Business Banking by -8%.
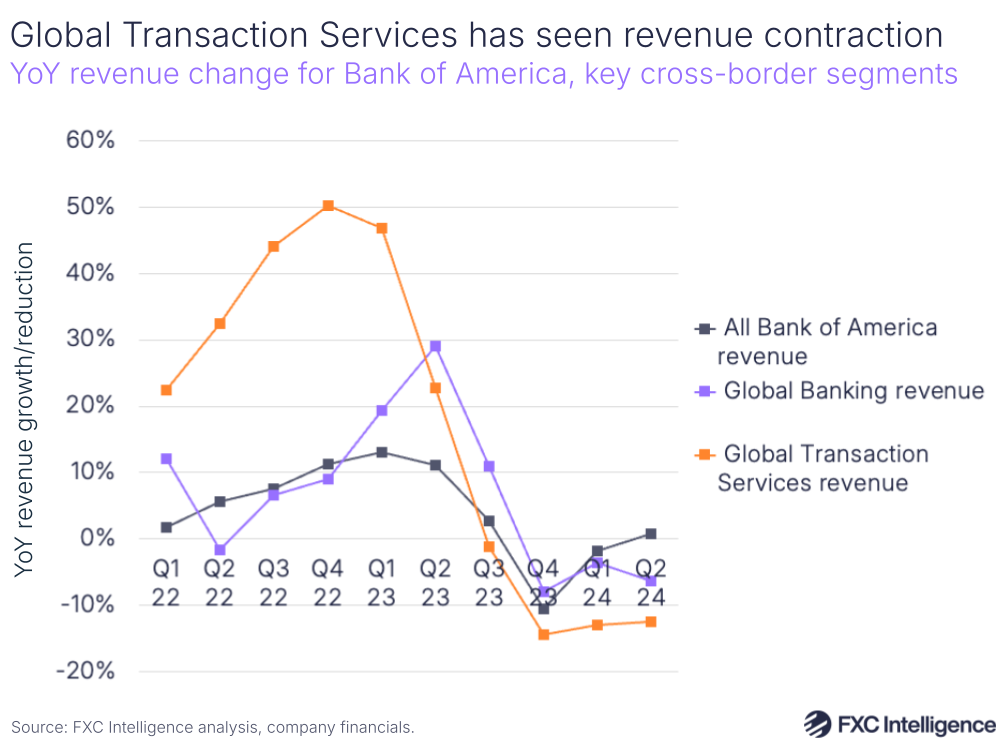
This decline is not unique to Global Transaction Services. Global Banking as a wider segment has also seen a recent period of YoY declines in successive quarters, as has Bank of America as a whole, although it did return to positive YoY growth in Q2 of this year.
However, Global Transaction Services has seen more pronounced declines than its wider business unit, following a period of much more elevated growth across 2022 and into early 2023.
In its latest earnings call, Bank of America reported that its Global Banking segment had seen improved investment banking fees and revenue from treasury services, but attributed the overall declines to the impact of interest rates, which produced lower net interest revenue (which BoA refers to as interest income), and deposit rotation.
This was echoed in Global Treasury Services, where the company highlighted fees for managing the cash of clients, adding that clients were using capital markets to access capital rather than borrowing, but attributed revenue declines to net interest revenue drops as a result of higher interest rates.
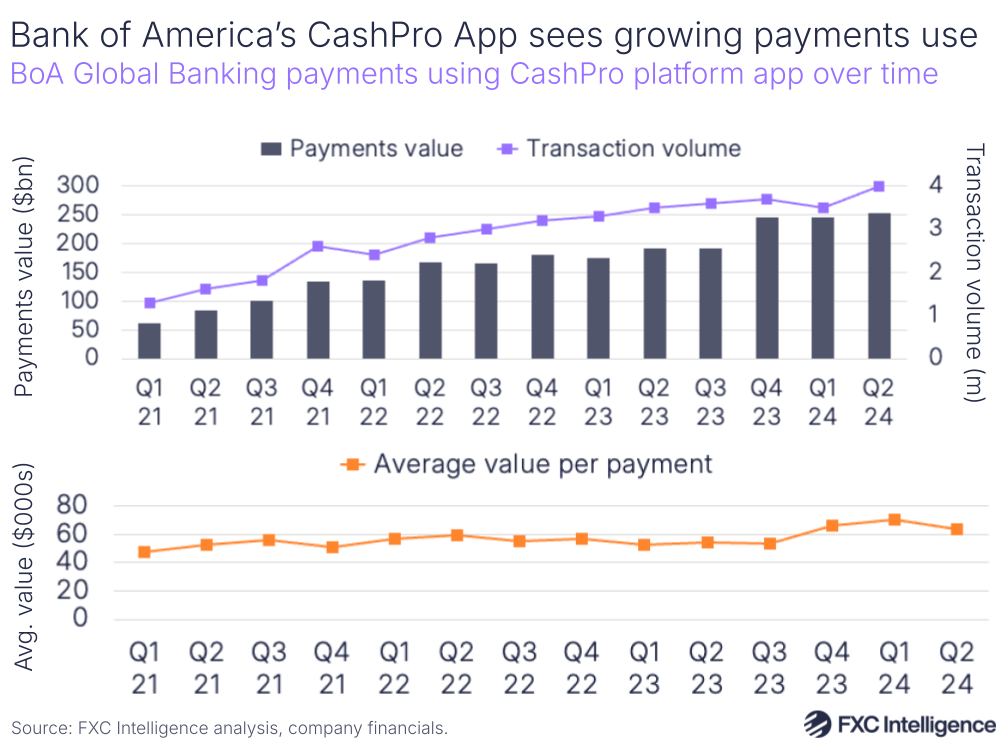
However, the company did also provide an update on its ongoing efforts to support digitisation in the space, with 87% of its Global Banking clients now accessing the company’s services digitally.
Here, the company has provided a quarterly breakdown of payments flows and transaction numbers for the app associated with CashPro – the digital platform for the Global Banking segment. This covers both domestic and cross-border payments made via the app and shows that both flows and transaction numbers have been consistently growing.
CashPro App flows reached $253bn across four million transactions in Q2 2024, for an average payment value of around $63,250 – increasing by more than $10,000 since Q2 2021.
Barclays
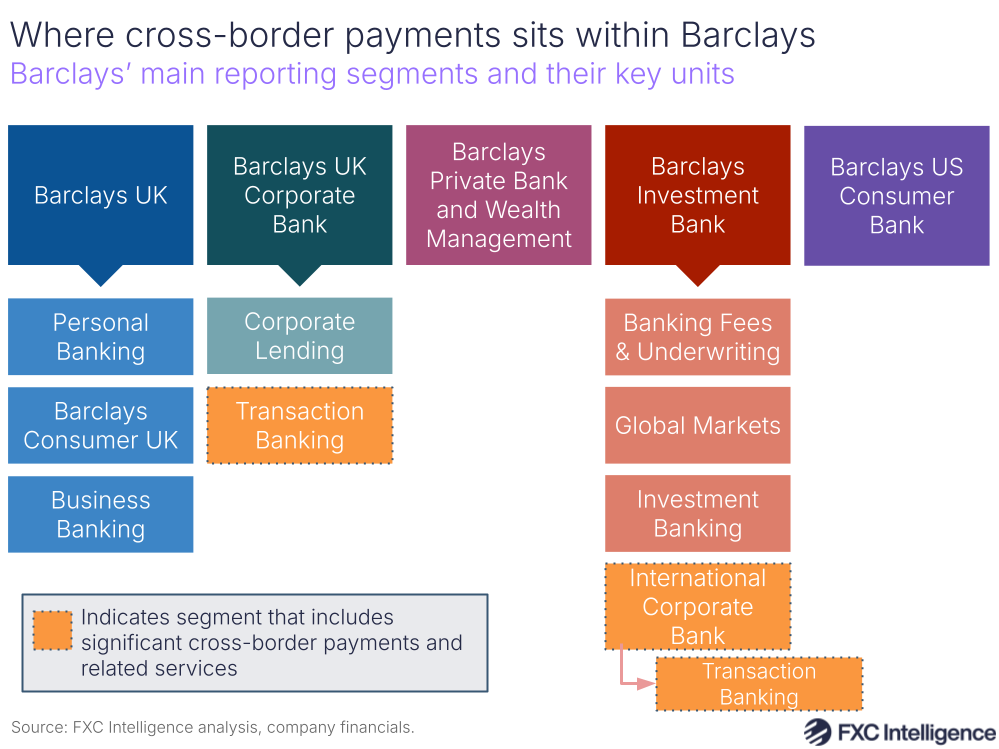
UK-headquartered Barclays does not explicitly publish data related to its cross-border payments offering, however the company does currently report two Transaction Banking units in which B2B cross-border payments play a significant role. The first is one of two units within Barclays Corporate Bank UK, while the second sits under International Corporate Bank, which itself is part of Barclays Investment Bank.
These were previously reported as part of a broader single Transaction Banking line item within the company’s Corporate reporting, until the bank announced a restructure at its February 2024 Investor Update. Prior to this, Barclays Group was made up of Barclays UK and Barclays International, the latter of which was made up of two sub-categories: Corporate and Investment Bank and Consumer, Cards and Payments.
While Barclays UK has remained largely unchanged, Barclays International has been subdivided as the company looks to reduce organisational complexity, increase returns and improve the balance of the business. This has seen Corporate and Investment Bank divided, with one part separated to form Barclays Investment Bank while the other has been merged with a former part of Consumer, Cards and Payments to form Barclays UK Corporate Bank.
The remaining parts of Consumer, Cards and Payments – which previously included the company’s payments acceptance and point-of-sale business Barclaycard Payments, as well as a broad range of consumer and cards-related business areas – have now been separated into Barclays US Consumer Bank and Barclays Private Bank & Wealth Management.
While this means that transaction banking is now reported as two line items, Matt Hammerstein, Chief Executive of Barclays Corporate Bank, said during the investor update that the underlying global capabilities still cover both corporate units.
“Although the UK Corporate Bank and International Corporate Bank are now reported through different divisions, our global transaction banking capabilities span those divisions, which we view as a core strength, enabling us to enhance our client proposition and create operational efficiencies for the two divisions,” said Hammerstein during the call.
Barclays does have other cross-border payments services for other parts of its customer base, including consumer and SME customers, however these are not sufficient revenue contributors to be broken out in a meaningful way within the company’s earnings. In the UK, Barclays requires new Corporate Banking clients to have a turnover of at least £6.5m per year.
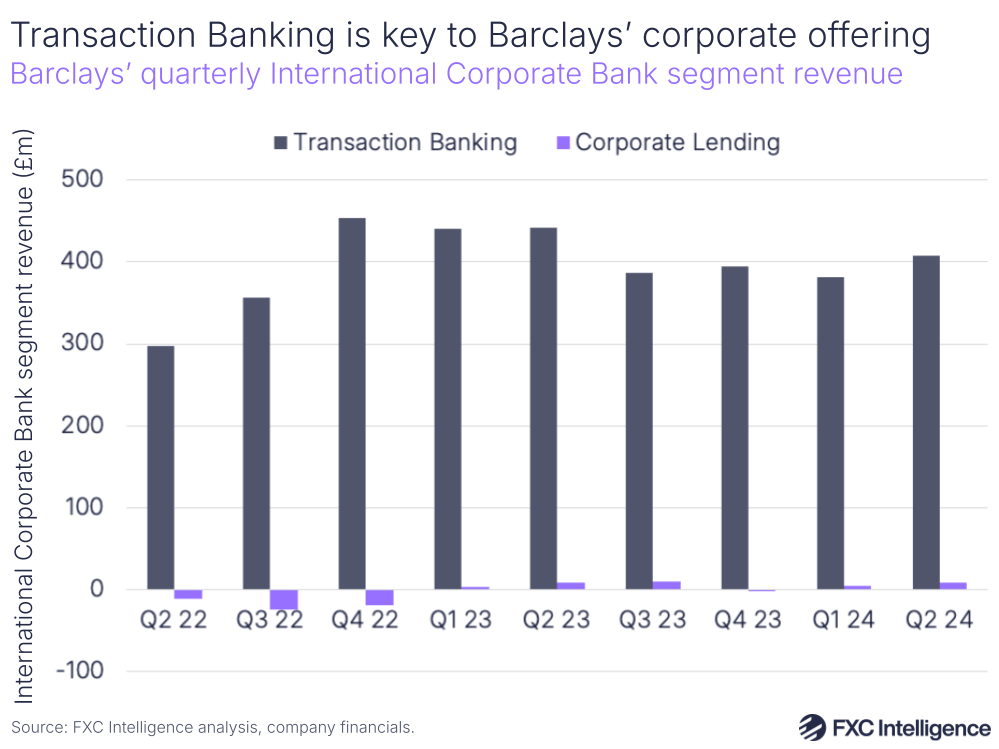
Within the International Corporate Bank, transaction banking is a major contributor, accounting for 82% of the segment’s revenue (which Barclays refers to as income) in Q2 2024. Its revenue share has passed 100% in several previous quarters because the other contributor to the segment, Corporate Lending, has reported a loss.
Catering to a wide range of corporate customers, Barclays’ International Corporate Bank offers services including domestic and cross-border payments, alongside currency clearing, FX and digital banking, as well as trade and working capital, lending and cash management. As a result, while the share of its transaction banking that is cross-border is not explicitly broken out, it is likely to be a significant contributor.
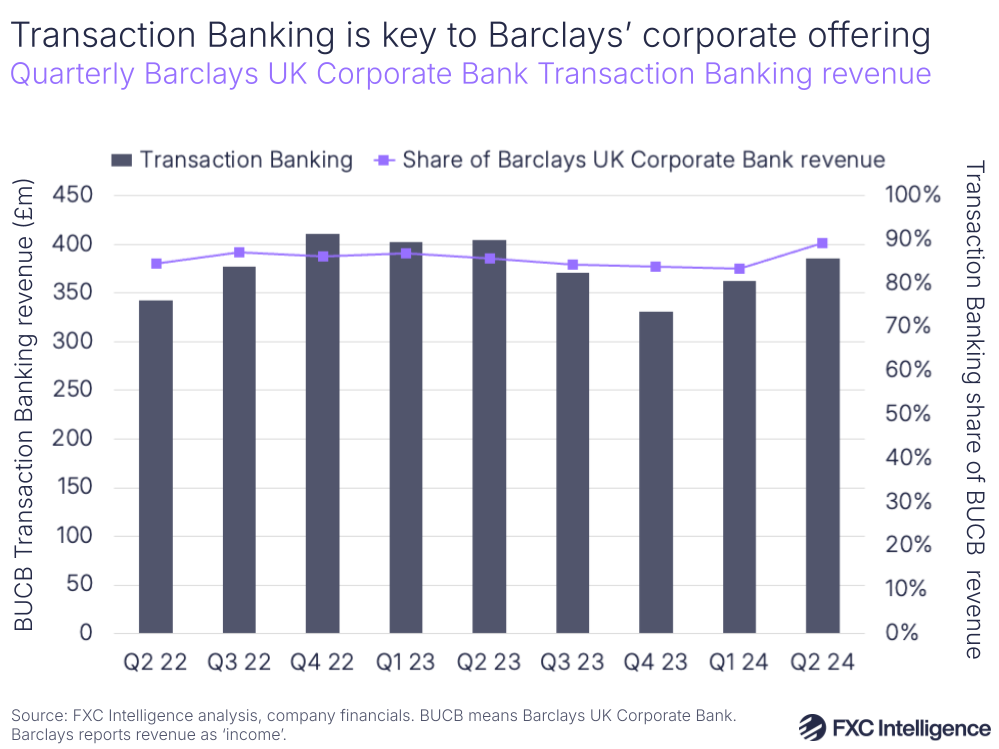
On the UK Corporate Bank side, while transaction banking has not accounted for more than 100% of the segment’s revenue during the period that data is available for, it is also the majority contributor, accounting for 89% as of Q2 2024.
Alongside domestic and cross-border payment services, foreign exchange and trade, the segment also includes solutions related to lending, liquidity and working capital.
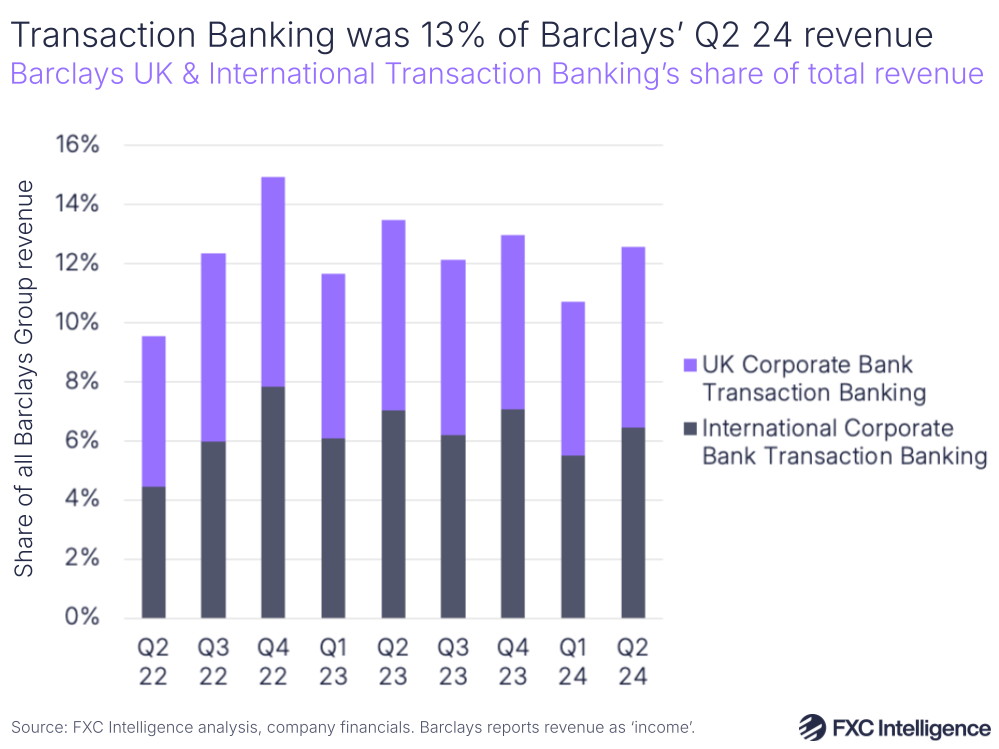
Combined, the two transaction banking units are a significant contributor to Barclays Group’s top-level revenue, accounting for 12.6% of all revenue in Q2 2024. Within this, International Corporate transaction banking accounted for 6.5% of all revenue, while UK Corporate transaction banking accounted for 6.1%.
While transaction banking’s share varies slightly by quarter, it generally remains relatively consistent; the lowest quarterly share in the last two years occurred in Q1 2024, when they together accounted for 10.7%, while in Q4 2022 their share peaked at 14.9%.
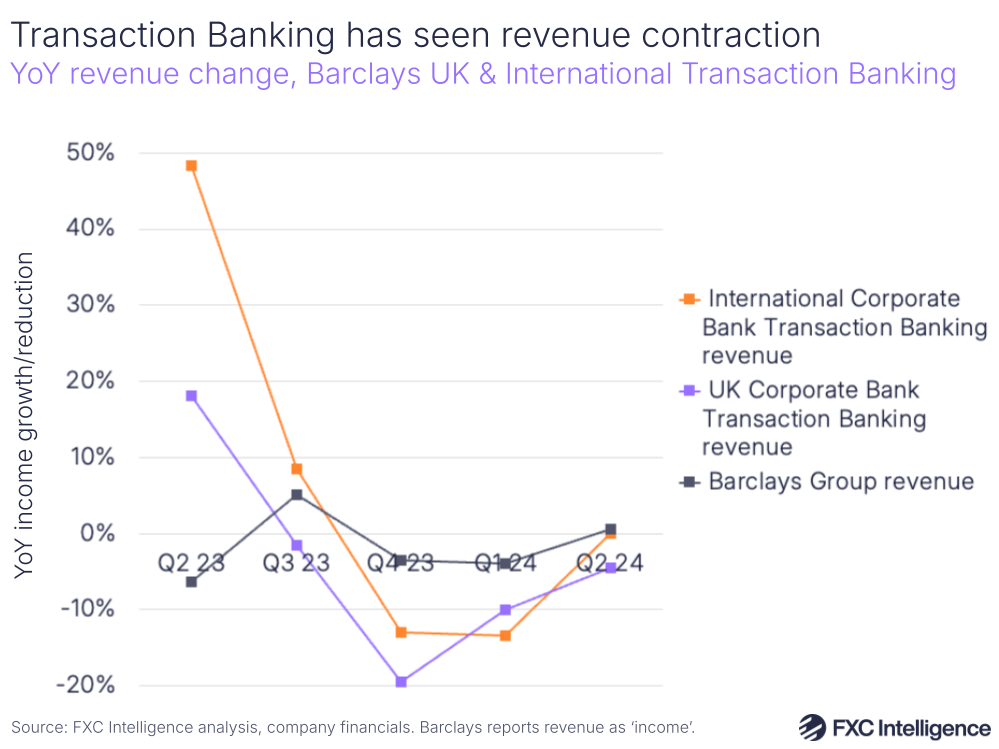
However, both International and UK Corporate transaction banking have seen successive YoY reductions in revenue over the past three quarters, following YoY gains earlier in 2023. Notably, this does not follow the shape of the wider revenue performance of the Group, although Barclays as a whole has seen YoY revenue reductions in most recent quarters, with only Q2 2024 seeing flat growth.
As with Bank of America, reductions have largely been attributed to the recent interest rate and inflationary environment.
BNP Paribas
France-headquartered BNP Paribas breaks out its cross-border payments contribution less explicitly than many other players, however it is most strongly present within the company’s Corporate & Institutional Banking segment. This is one of three that makes up the banking group, along with Commercial, Personal & Banking Services and Investment & Protection Services.
Within Corporate & Institutional Banking is the company’s Global Banking unit, which provides a range of international banking solutions, including several around cross-border payments. These are offered through the unit’s Transaction Banking service, with other units under Global Banking including Capital Markets and Advisory.
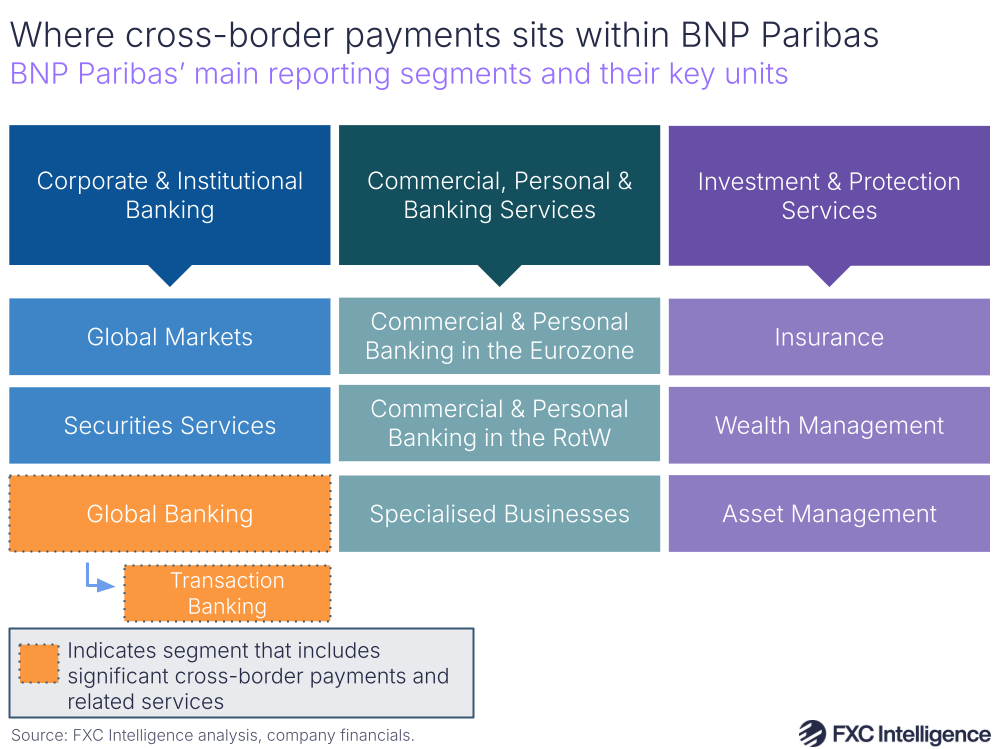
Services provided by the company’s Global Banking service vary slightly by region, but generally include areas such as working capital and trade management, while the Transaction Banking section particularly focuses on areas including liquidity management, trade and supply chain finance and foreign exchange solutions.
While Global Banking overall represents other areas beyond Transaction Banking, it is the best consistent measure of BNP Paribas’ cross-border offering as the company does not break out revenue data for Transaction Banking on its own.
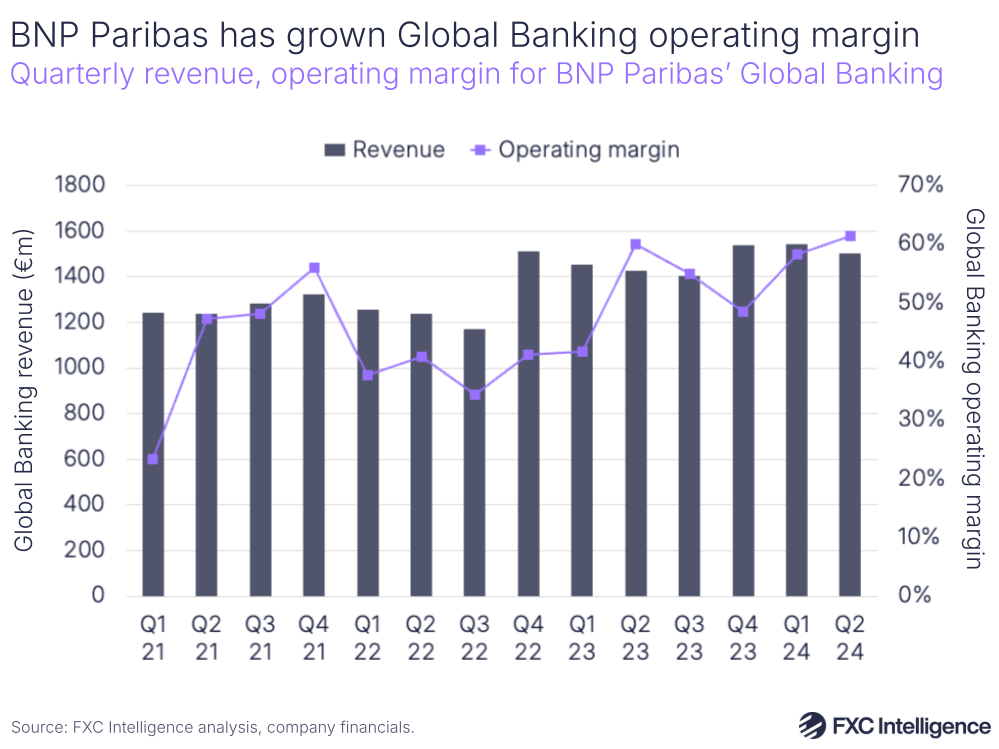
While the company reported an increase in operating expenses for Global Banking in Q2 2024, Transaction Banking has been consistently cited as a key driver of the unit’s growth across all recent earnings calls. In Q2 2024, Cash Management and Trade Finance were both highlighted as strong areas of activity for Transaction Banking, while in Q1 the company highlighted the robustness of the EMEA Cash Management area in particular against the wider interest rate environment.
Global Banking has also seen its operating margin trend upwards over the past few years.
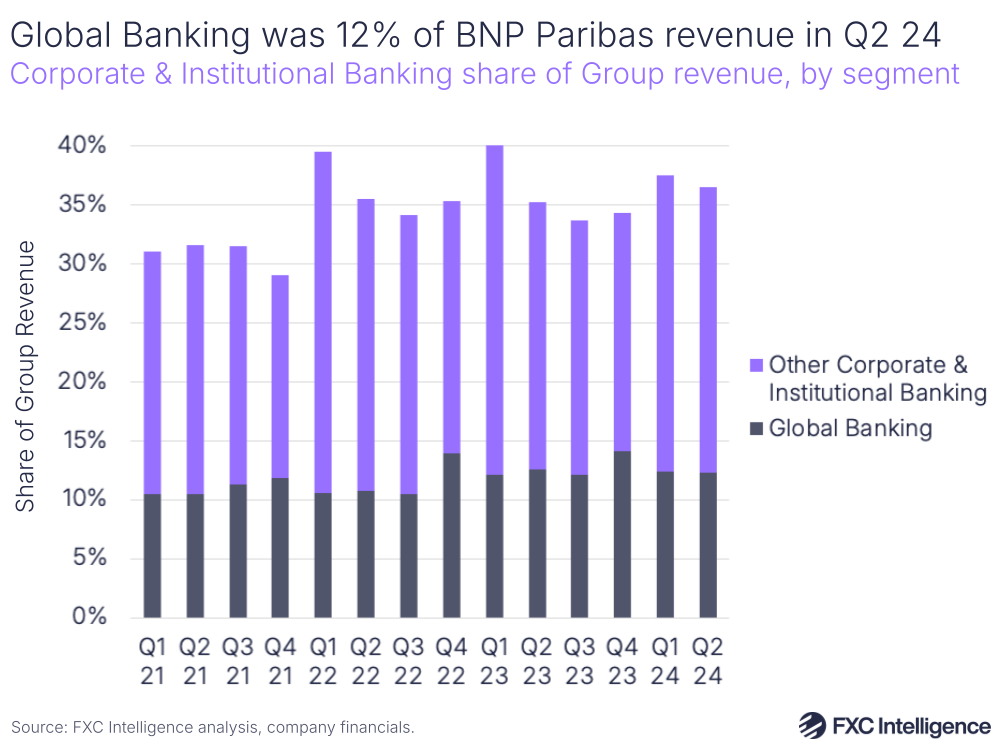
Global Banking’s share of overall Group revenues was 12.2% in Q2 2024, with most quarters seeing a fairly similar share, although Q1 2024 saw the highest share of the past few years at 14.1%.
Global Banking consistently accounts for around a third of the Corporate & Institutional Banking segment’s revenue, seeing a 34% share in Q2 2024.
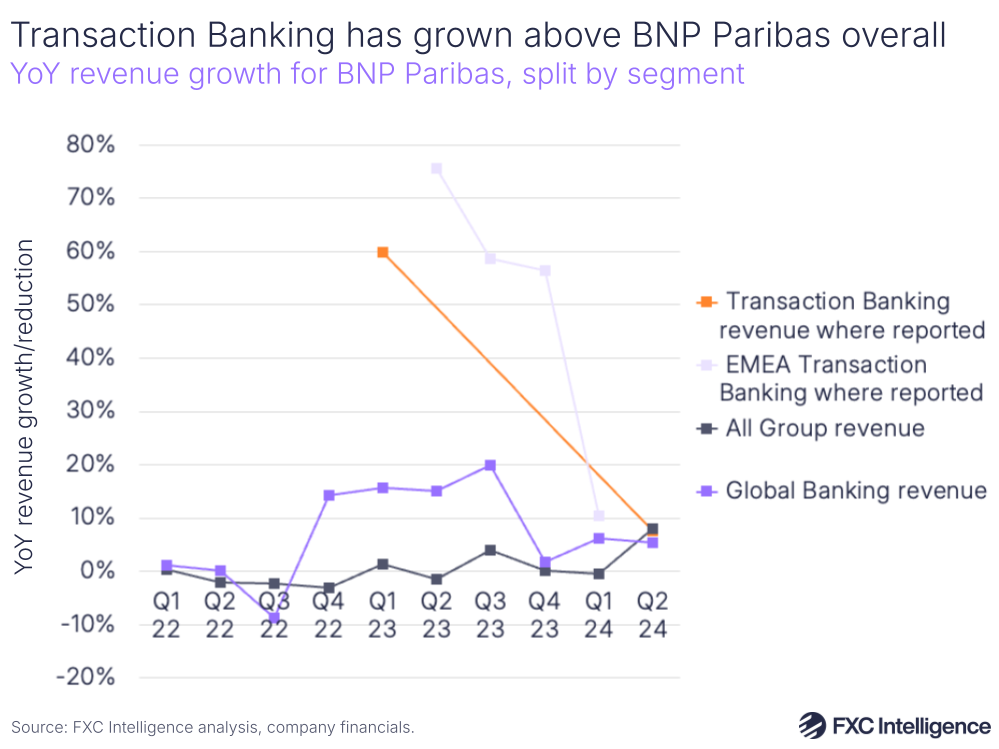
While BNP Paribas does not publish direct revenue data for Transaction Banking, it has published YoY growth rates for multiple recent quarters. As it does not provide these every quarter, the ones shared are likely to be higher than average rather than representative of general trends for the unit, but do indicate strong growth.
Transaction Banking overall has only seen two YoY revenue growth rate figures published recently: 59.8% in Q1 2023 and 7.6% in Q2 2024. Meanwhile, the company has shared several growth rates for its EMEA segment, which saw 10.5% YoY growth in Q1 2024 and 56.4% YoY growth in Q4 2023.
By contrast, Global Banking revenue has generally seen positive but more muted growth over the past few years, while the wider group has maintained low single-digit growth or contraction in most quarters, with its most recent 8% YoY growth in Q2 2024 being an outlier.
Citi
US banking major Citi does not directly report revenue numbers for either cross-border payments or its wider corporate-focused Payments unit, however data is available for the company’s Treasury and Trade Solutions unit, which Payments is a part of. This in turn is part of the company’s Services division, which sits alongside Markets; Banking; US Personal Banking; and Wealth, along with All Other, to form Citigroup as a whole.
This structure has only been recently established. Prior to this year, the company reported across four segments: Institutional Clients Group; Personal Banking and Wealth Management; Legacy Franchises; and Corporate/Other. However, in September 2023 the company announced that it was restructuring to create what Citi CEO Jane Fraser, speaking in the company’s Q4 2023 earnings call, described as “five core, interconnected businesses”. She explained that this was to better align the organisation to the company’s business strategy, as well as increase transparency.
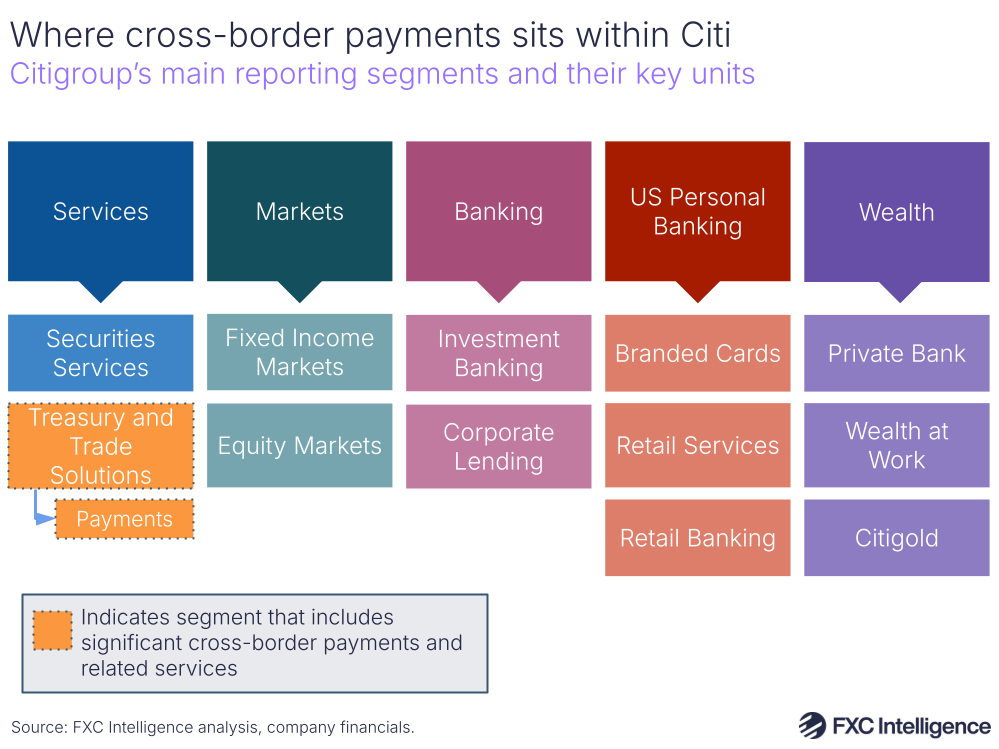
While Payments accounts for a significant portion of Trade and Treasury Solutions (TTS), the segment also covers Liquidity Management Services, Trade & Working Capital Solutions and Securities Services.
While cross-border payments is characterised as the lead offering of the Payments division by much of Citi’s marketing materials, it also covers domestic payments, as well as services including its ecommerce and digital payments acceptance solution Spring by Citi, alongside clearing, banking as a service and commercial cards.
Cross-border payments itself is powered by Citi’s WorldLink Payment Services offering, supporting payouts to accounts, cards and wallets in more than 135 currencies. WorldLink itself is used for a broad range of applications across commercial payments, investor relations, legal payments, employee compensation and education payments.
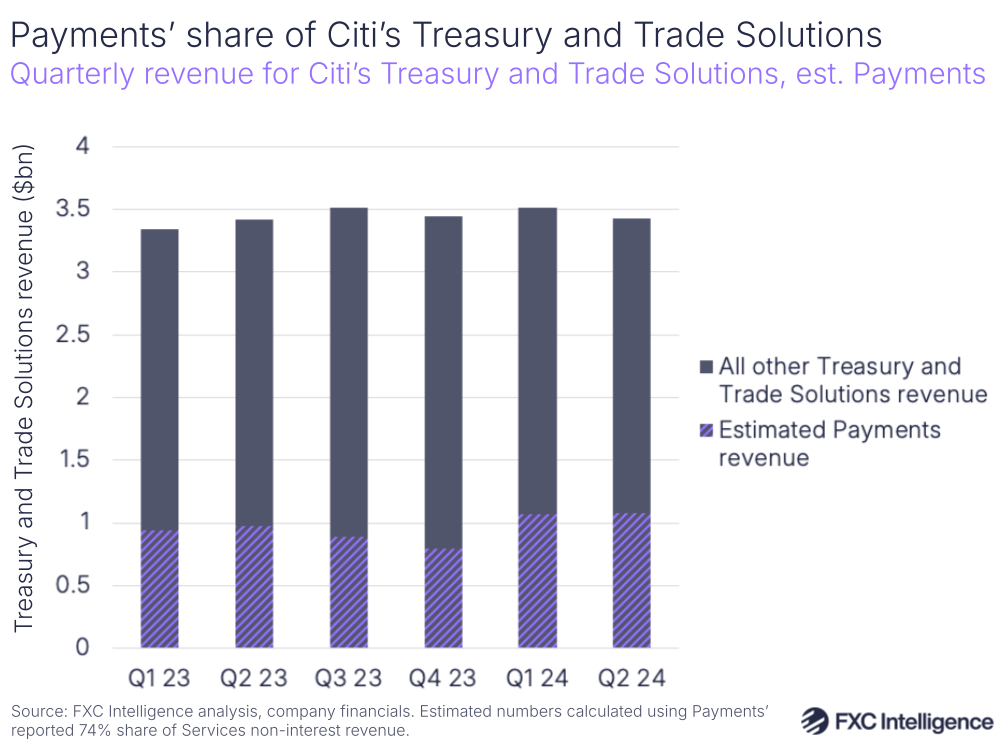
However, while cross-border payments is likely to be a major contributor to Payments, it is unlikely to be the majority of Treasury and Trade Solutions revenue, let alone Services, although it is key to its non-interest revenue. During its Investor Day, Citi reported that Payments overall contributes to around 74% of Services non-interest revenue, which would make Payments overall account for around 30% of all TTS revenue.
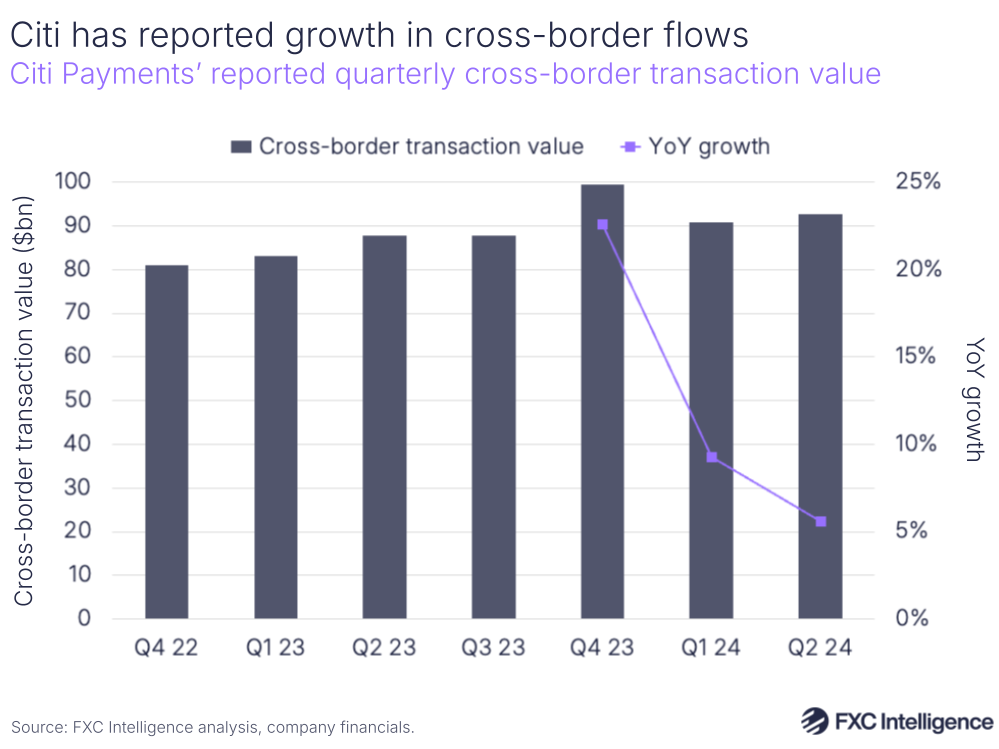
Meanwhile in Q2 2024, Citi reported that non-interest revenue contributed a 14% uplift to TTS revenue, citing a 6% increase in cross-border transaction value as a primary driver.
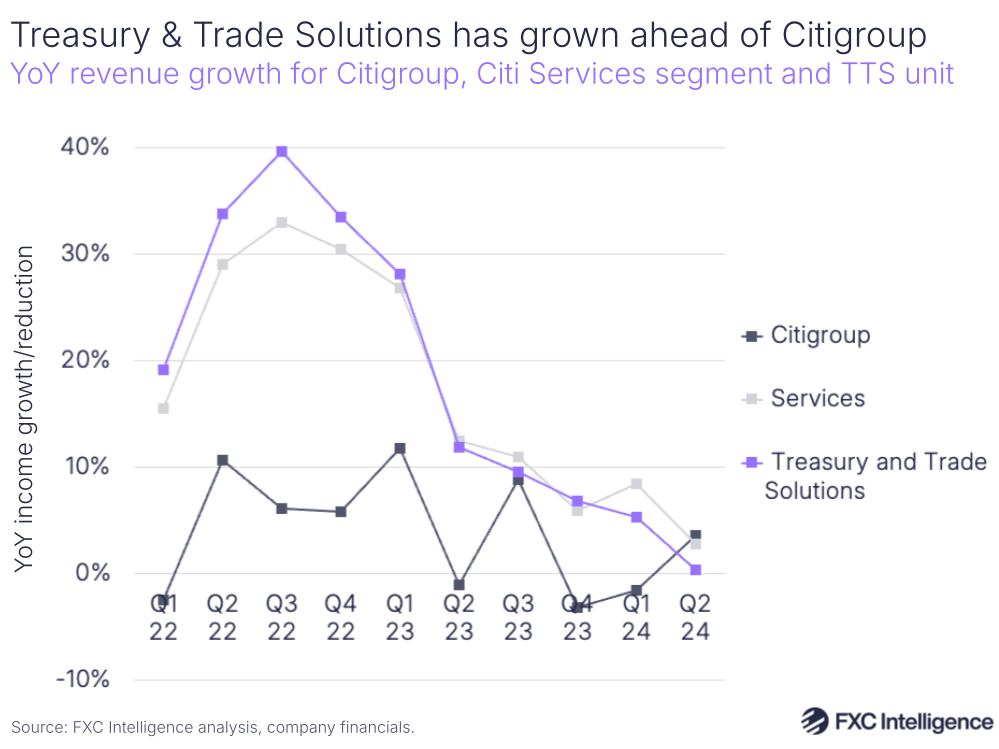
Cross-border payments were highlighted as a key success within TTS and the wider Services division in the company’s Q2 2024 earnings call, with the company reporting cross-border revenue growth of 23% YoY, although not providing the numbers that underpin this.
However, since the restructure the company has reported its cross-border payments flows, with total transaction value totalling $92.7bn in Q2 2024 and $358bn for full-year 2023. This sees flows in the latest quarter gain 6% on the previous year, while Citi has reported that its FY 2023 flows have seen a 13% CAGR since 2021’s $280bn.
Within its payments business, Citi serves around 17,000 clients, putting the average cross-border flows per client for FY 2023 at around $21m.
Its clients include around 80% of the Fortune 500, and Citi Payments says that it is a leader in large corporates, the public sector and financial institutions, reporting a 7.7% market share in these segments in its Investor Day presentation earlier this year. It is also seeing high growth in commercial bank clients, ecommerce, fintechs and payment institutions.
Overall, the Services division has consistently accounted for 20-25% of all Citigroup revenue net interest expense for the past two years, while Treasury and Trade Solutions alone typically accounts for 15-20%, reaching 17% in Q2 2024.
Based on its reported share of Services net interest revenue, Payments overall is likely to account for around 5% of Citigroup revenue, with cross-border payments forming part of this.
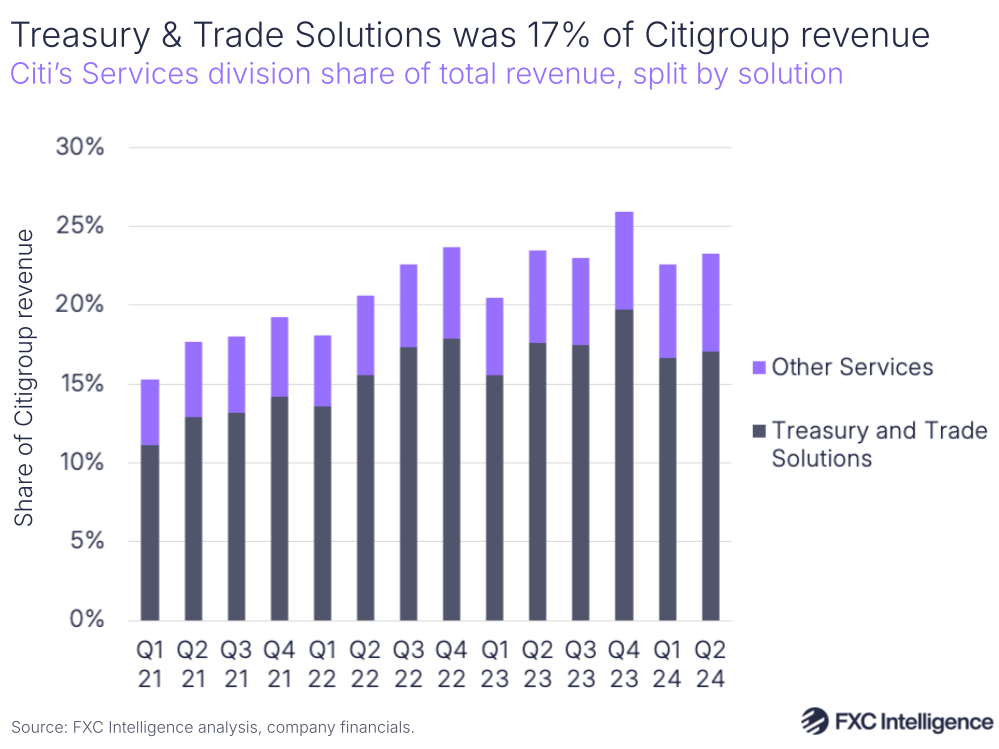
Both Services and Treasury and Trade Solutions saw strong YoY revenue growth across 2022, although this did slow from Q2 2023 and in Q2 2024 TTS saw near flat growth, at 0.32%. However, this was attributed to a contraction in net interest revenue (which Citi refers to as net interest income) as a result of investment in Argentina, with TTS non-interest revenue alone seeing a 14% YoY increase.
By contrast, Citigroup has generally seen lower YoY revenue growth, although in Q2 2024 rose above Services with a 3.6% YoY increase.
Get in touch to find out how we can support your cross-border payments strategy
Deutsche Bank
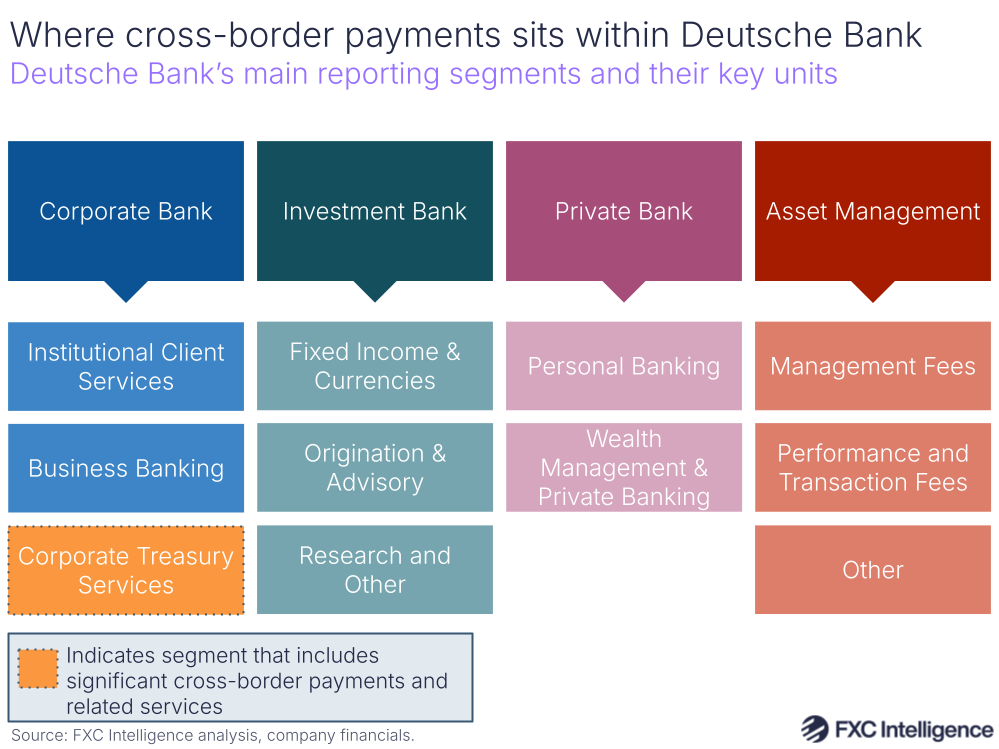
Germany’s Deutsche Bank is another that does not explicitly produce standalone financial results for cross-border payments. However, its offering is represented as part of Corporate Bank, one of the four segments that makes up the company, along with Investment Bank, Private Bank and Asset Management.
Within Corporate Bank, the company reports three lines: Corporate Treasury Services, Institutional Client Services and Business Banking. All three of these are likely to include some level of cross-border payments, although the extent will vary.
Corporate Treasury Services is the only one of the three where cross-border is explicitly mentioned on DB’s Corporate Bank webpage, with corporate client-focused services including liquidity management, FX, payment and trade finance.
Institutional Client Services, which is focused on financial institutions, issuers and investors, offers institutional cash management, trust and agency solutions that are likely to include some cross-border.
Meanwhile, Business Banking is focused on small businesses and self-employed business owners in Germany – a group that covers 99% of German businesses, according to the country’s federal statistical office Statistisches Bundesamt – and includes payment and credit solutions across brands Deutsche Bank, Postbank and FYRST. While this is likely to include some cross-border payments, it will be a lower contributor to unit revenue than for the company’s Corporate offering.
Corporate Bank’s primary cross-border payments service is Cross-border ACH, otherwise referred to as XB-ACH, which offers low-value ACH clearing in more than 120 currencies through an integration with Deutsche Bank’s FX4Cash FX trading platform. This is largely targeted at global corporates who need to make cross-border payments to vendors and suppliers.
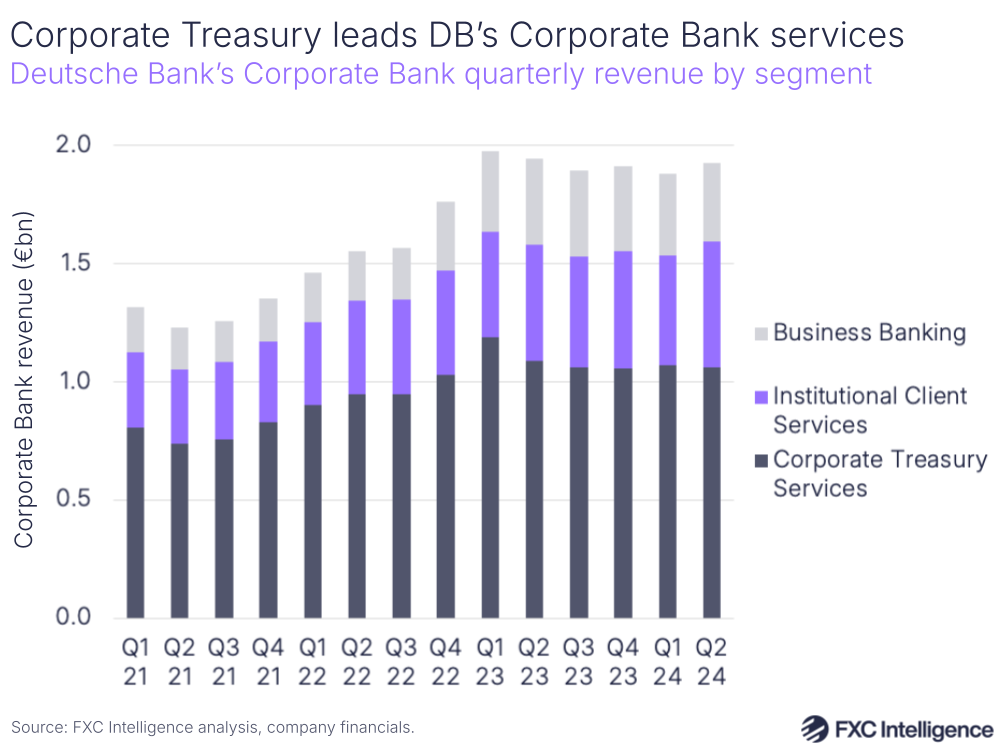
Within Corporate Bank, Corporate Treasury Services is the largest contributor of revenue, accounting for 55% as of Q2 2024. Institutional Client Services is the second largest, accounting for 28%, while Business Banking accounts for the remaining 17%.
These shares have remained relatively consistent over the past few years, although Business Banking has taken share from Corporate Treasury over time. This is largely due to a run of high growth between Q4 2022 and Q4 2023, where it saw year-on-year gains of around 60-70% each quarter.
This saw Business Banking move from an average revenue share of 14% in 2021 to an average share of 18% in 2023, while Corporate Treasury Services saw its average share change from 61% to 57% over the same period. Institutional Client Services, meanwhile, saw an average share of 25% in both years.
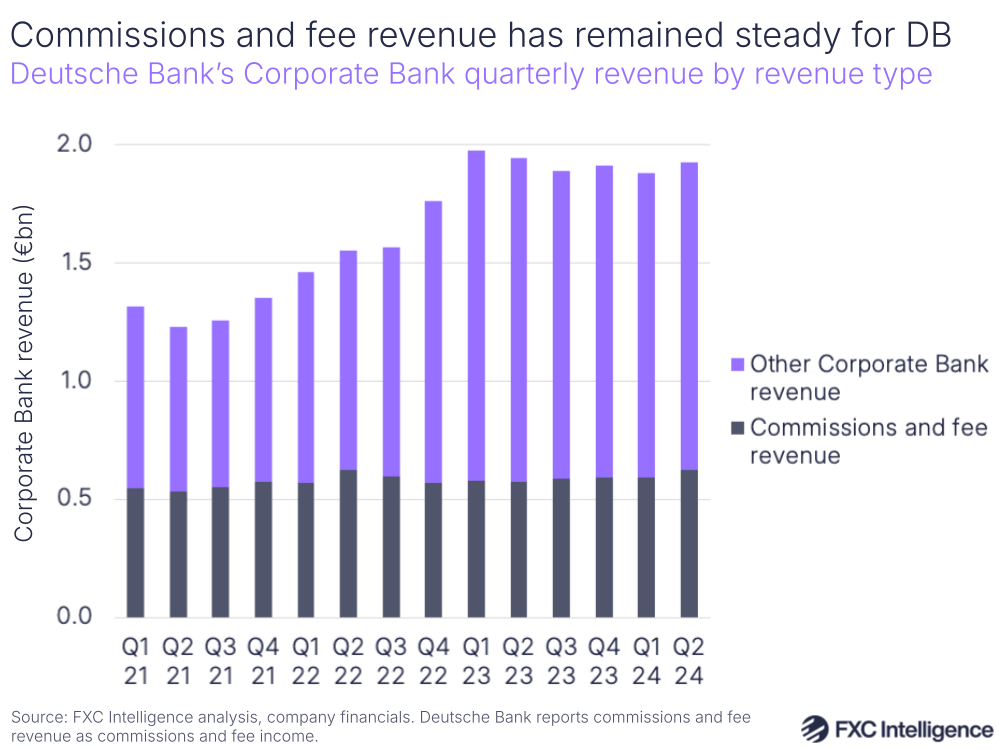
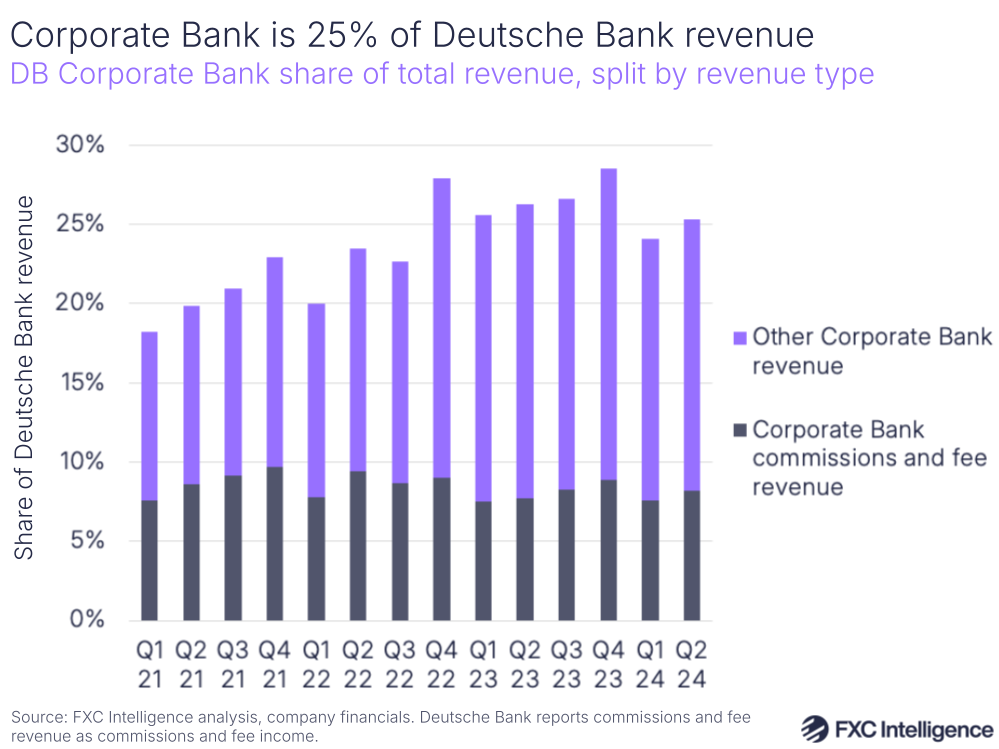
In order to get a better sense of how much cross-border payments is contributing to Deutsche Bank, however, it is also helpful to look at another split of Corporate Bank, namely the separation of commissions and fee revenue (which Deutsche Bank refers to as commissions and fee income), which is reported alongside net interest revenue (reported as net interest income) and remaining revenue. Commissions and fee revenue is likely to include the fees earned in delivery of cross-border services, making it a helpful metric that removes the larger reporting line of interest revenue.
While commissions and fee revenue has remained fairly consistent relative to the inflation-driven jumps in other Corporate Bank revenue – almost all of which is net interest revenue – it has been “behaving very well”, according to Deutsche Bank CEO Christian Sewing, speaking in the latest earnings call. The company reported a YoY increase of 6% in the latest quarter, driven by “growth across all regions”, with Sewing adding that investments in the company’s payment businesses “are paying off”.
As of Q2 2024, Corporate Bank contributed 25% of Deutsche Bank’s overall revenue and averaged a 26% share over the past four quarters. Corporate Treasury Services alone accounted for 14% of Deutsche Bank’s overall Q2 2024 revenue, while Institutional Client Services accounted for 7% and Business Banking 4%.
Looking at Corporate Bank commissions and fee revenue alone, this accounted for 8% of all Deutsche Bank revenue in Q2 2024.
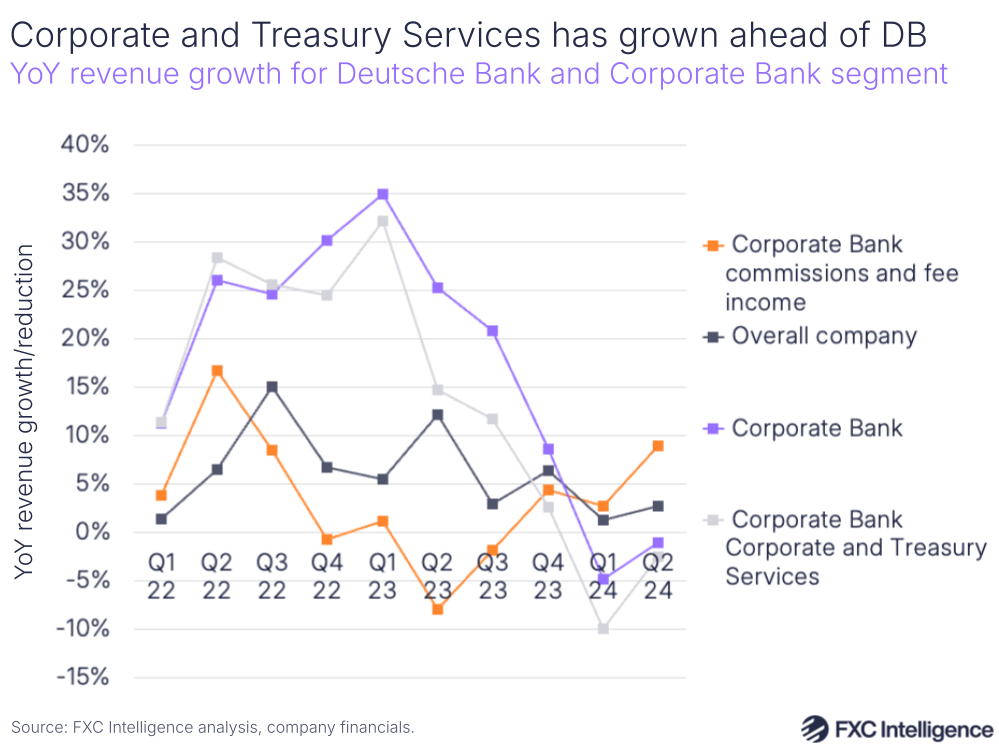
On YoY growth, Corporate Bank and its Corporate and Treasury Services unit both saw periods of elevated YoY growth across 2022 and the first three quarters of 2023, before seeing a contraction in recent quarters. This is largely driven by changes in interest revenue, and is reflective of other bank segments with similar revenue profiles.
However, Corporate Bank commission and fee revenue saw a period of slight contraction across 2023 before returning to growth in 2024, while Deutsche Bank overall has seen consistent, largely single-digit growth over the past few years.
Goldman Sachs
Investment-focused Goldman Sachs has some of the least financial data relating to its cross-border business, which is exacerbated by a recent reorganisation of the company.
At the end of 2022, the company announced that it would be changing its reporting structure from four top-level business segments – Investment Banking, Global Markets, Asset Management and Consumer & Wealth Management – to three: Global Banking & Markets, Asset & Wealth Management and Platform Solutions. This saw an extensive rearrangement of how the company’s underlying businesses were reported, including the updated reporting of its Transaction Banking business, which is the main area for its cross-border offering.
While this had previously been reported in the company’s Investment Banking Segment, it is now reported as part of the company’s Platform Services business, although comparable data is only available back to Q2 2022 as a result of the restructuring.
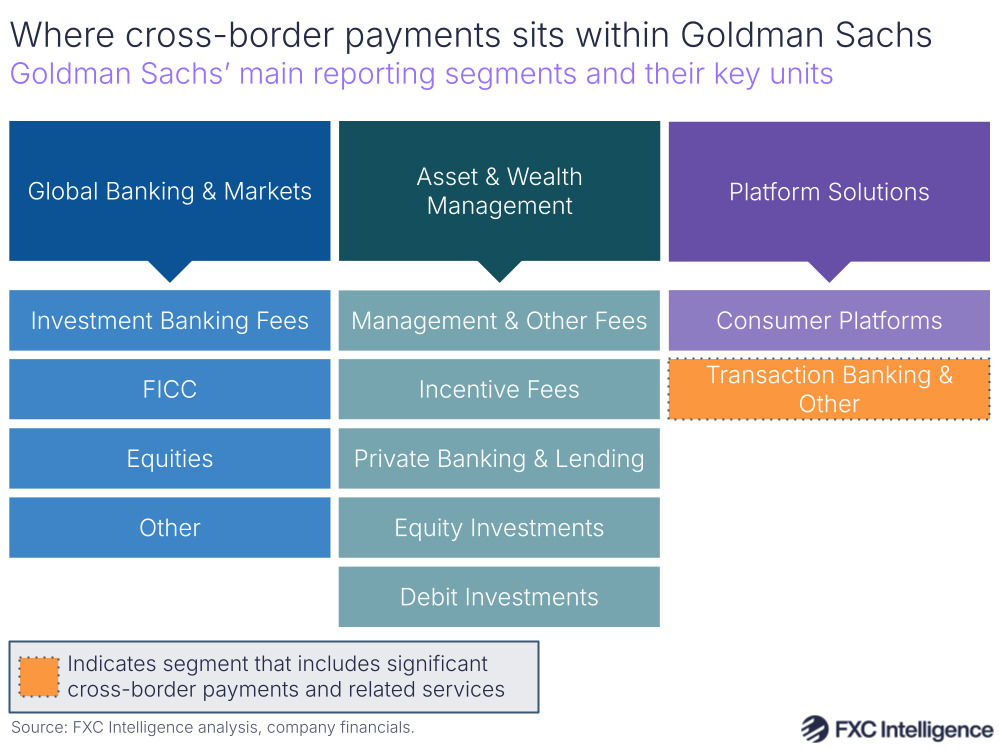
Designed specifically for corporate treasurers and other payments executives, Goldman Sachs’ Transaction Banking platform, also known as TxB, provides domestic and cross-border payments as well as liquidity solutions, escrow services and banking-as-a-service solutions. As a result, while global FX payments is central to Transaction Banking’s offerings, cross-border payments does not account for all of this unit’s reporting, with net interest revenue ( attributed to transaction banking deposits also among the metrics included.
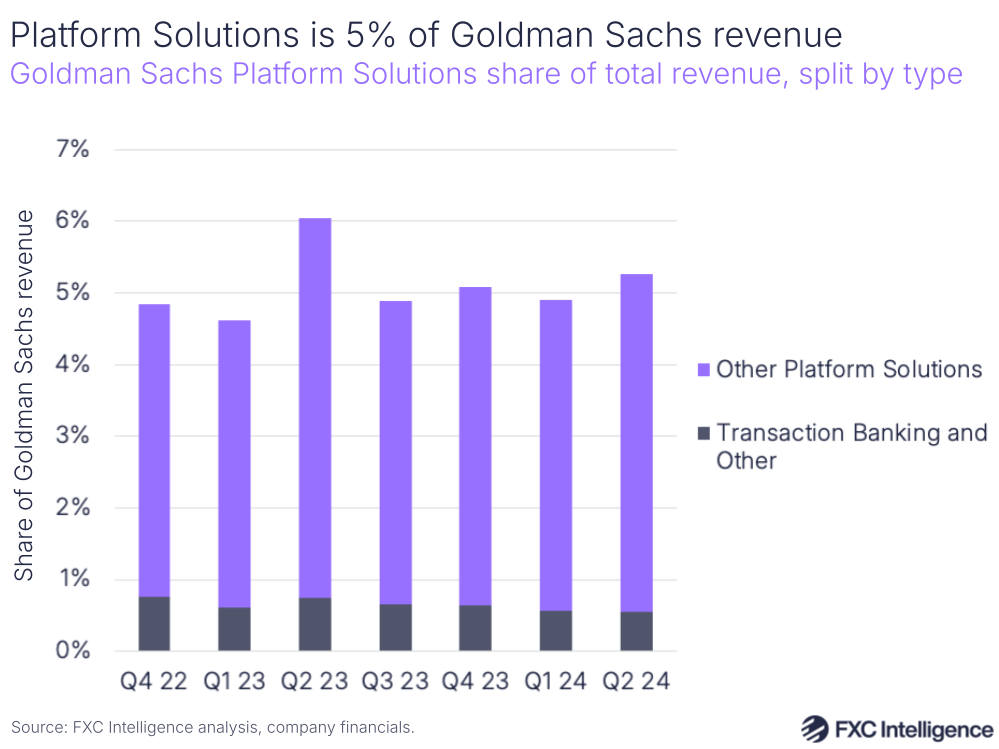
Transaction Banking accounted for 10.5% of Platform Solutions revenue in Q2 2024, its lowest share in the period data is available for. The segment’s share peaked at 15.6% in Q4 2022.
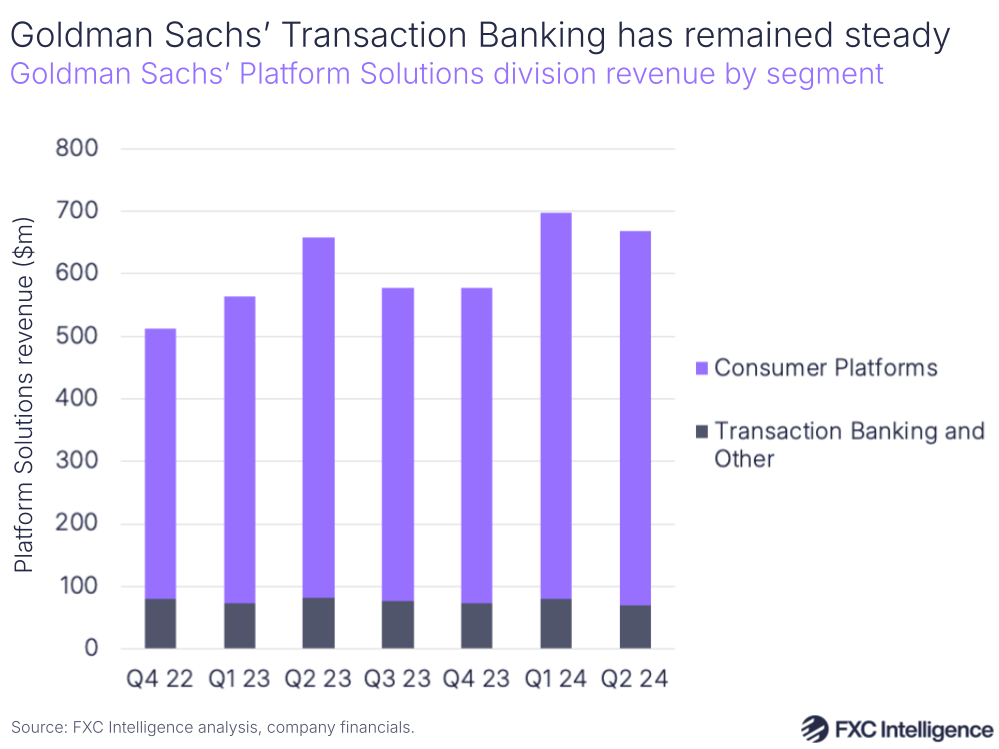
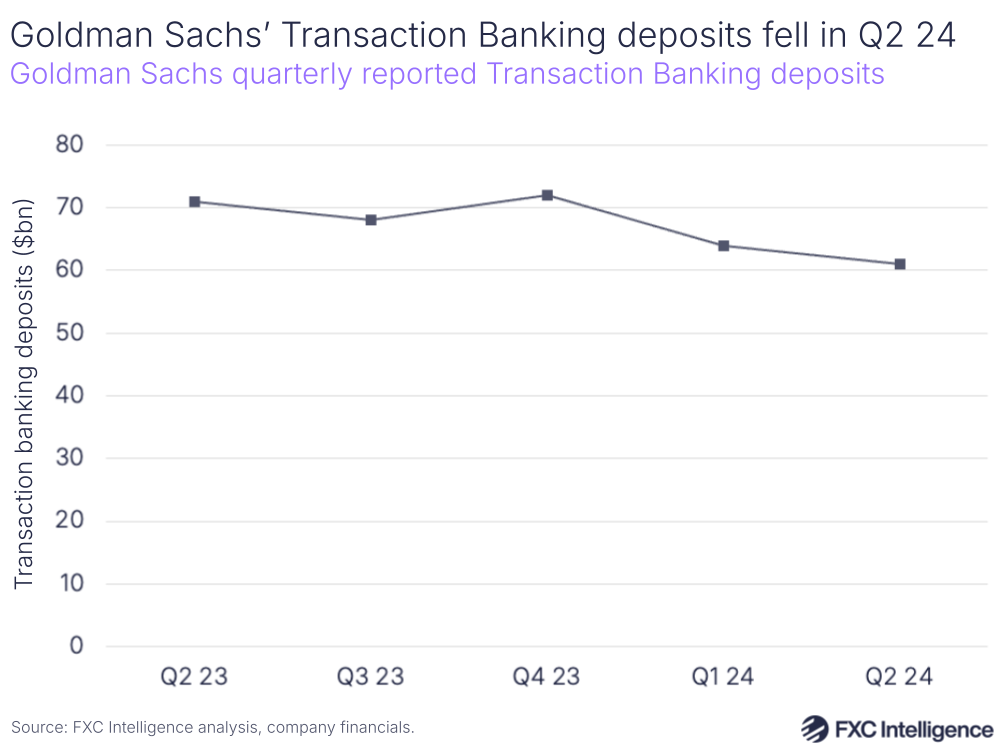
Notably, Goldman Sachs reported lower average deposit balances in its Transaction Banking segment in Q2 2024, with deposits at $61bn. This represents a -14% contraction on Q2 2023, when Transaction Banking held $71bn in deposits.
Given such deposits are held as part of clients’ broader use of the TxB platform, this suggests that there has been a drop in use over the past year.
Transaction Banking itself accounted for 0.55% of all Goldman Sachs’ revenue as of Q2 2024, the lowest contribution across the period data is available for. This share also peaked in Q4 2022, the earliest quarter data is provided for, at 0.76%.
However, the wider Platform Solutions segment accounted for 5.3% of all revenue as of Q2 2024, an improvement on the last three quarters and second only to Q2 2023’s 6.1% share in the period data is available for.
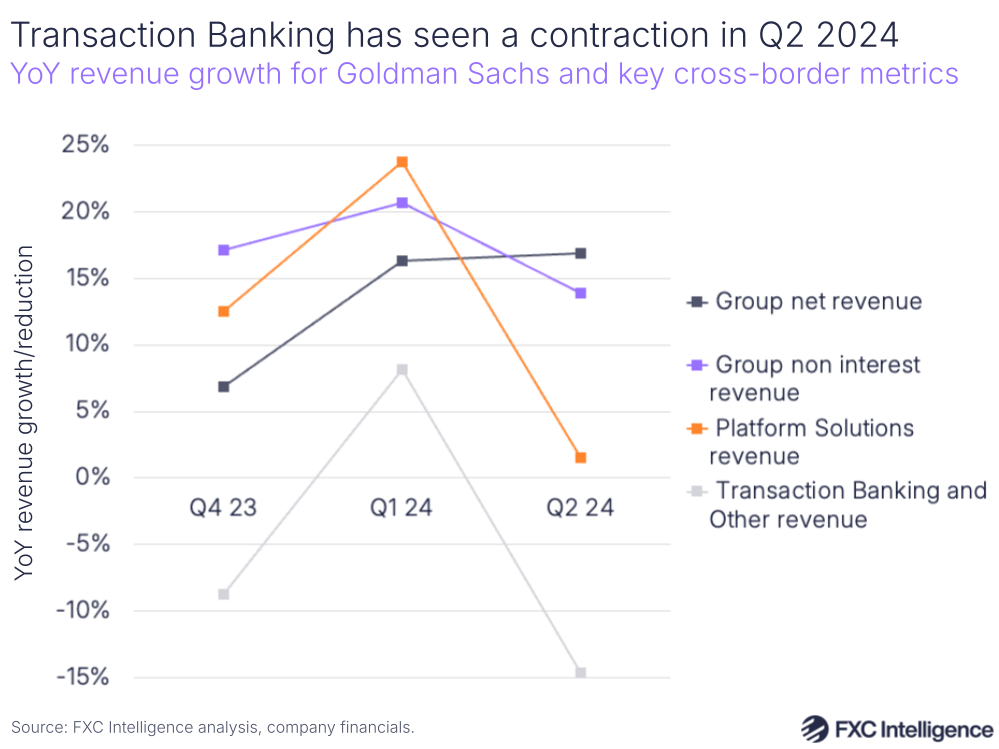
Lower balance holdings in Transaction Banking has also contributed to a revenue contraction, with Goldman Sachs reporting that the segment saw a -15% YoY revenue reduction in Q2 2024. While this followed an 8% increase YoY in Q1 2024, Q4 2023 also saw a decline of -9%.
By contrast, while Platform Solutions also saw lower YoY growth in Q2 than Q1, it remained positive at 2%. Overall, Goldman saw a 17% increase in revenue during the same period.
HSBC
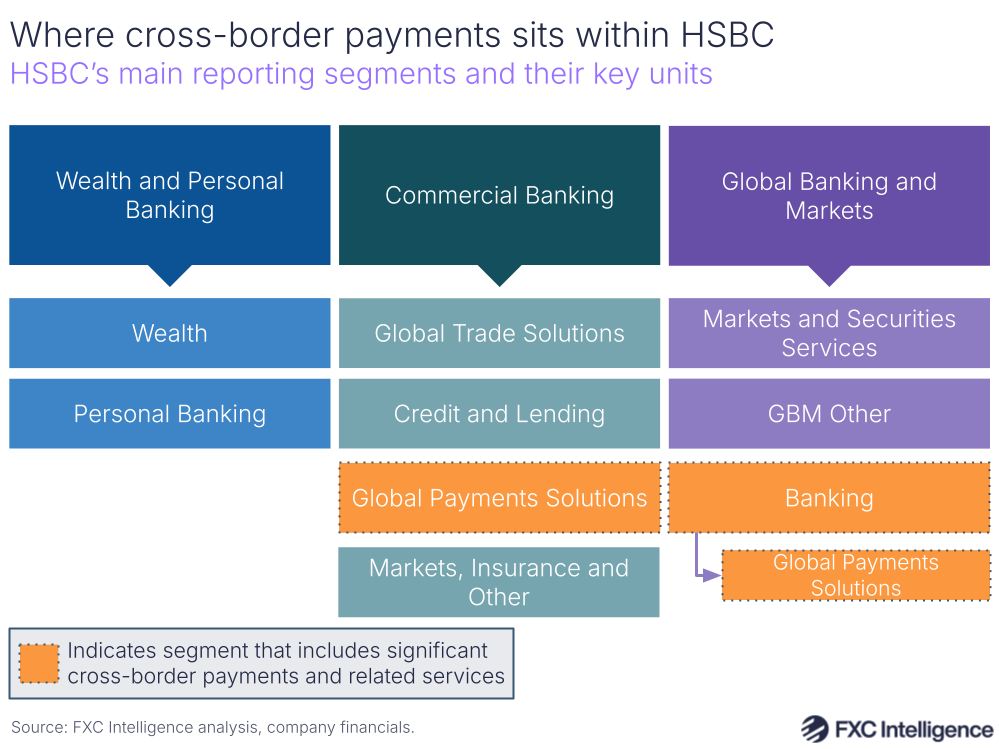
UK-headquartered, but traditionally Asia-focused, HSBC has a fairly significant cross-border presence in its financial reporting through its Global Payments Solutions product set.
This is a suite of cross-border payments-related solutions that includes global corporate cards and wallets; retail and ecommerce collection; cross-border and domestic payables and receivables; and foreign currency and clearing, as well as additional global trade-related products such as cash flow forecasting and liquidity solutions.
Global Payments Solutions is reported within two of the three global businesses that make up HSBC: Commercial Banking, which serves globally focused small enterprises and large companies, and Global Banking and Markets, which serves corporates, governments and institutions.
While Global Payments Solutions is one of the four main segments within Commercial Banking, in Global Banking and Markets it is reported under the Banking segment.
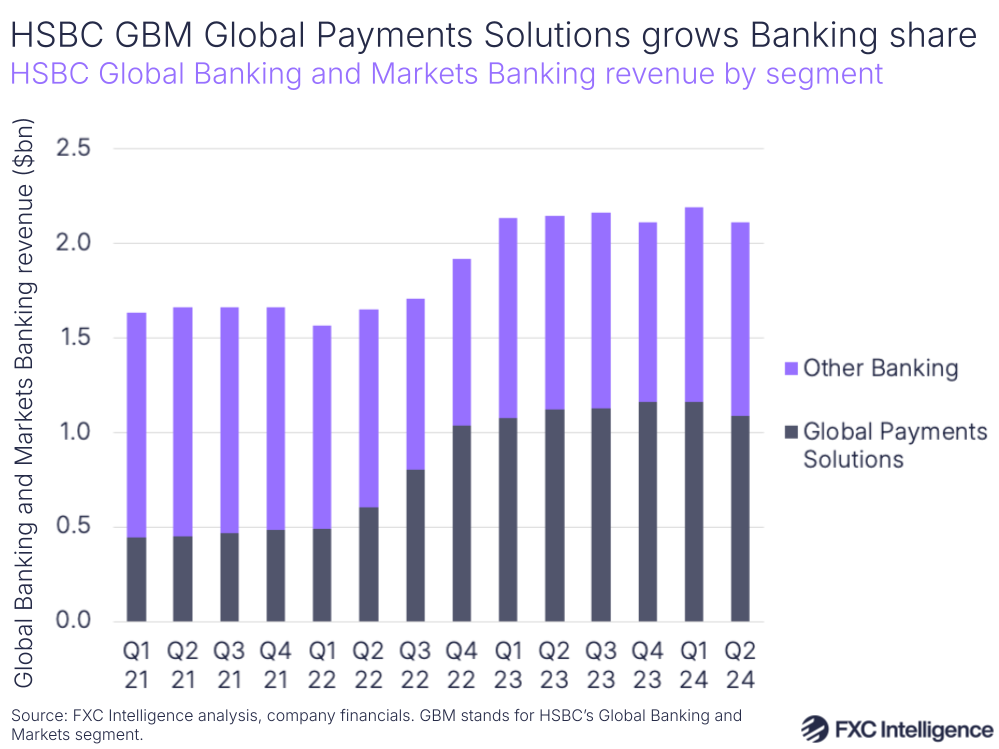
As of Q2 2024, Global Payment Solutions accounted for 51% of HSBC’s Global Banking and Markets’ Banking segment, with revenue of $1.1bn. It has seen its share increase significantly over the past few years however, having accounted for only 27% in Q2 2021. Its share jumped sharply across 2022 in particular, and has remained at around 50% since.
Looking to the wider business unit, Global Payments accounted for 25% of Global Banking and Markets (GBM) in Q2 2024, although saw its share peak at 31% in both Q4 2022 and Q4 2023.
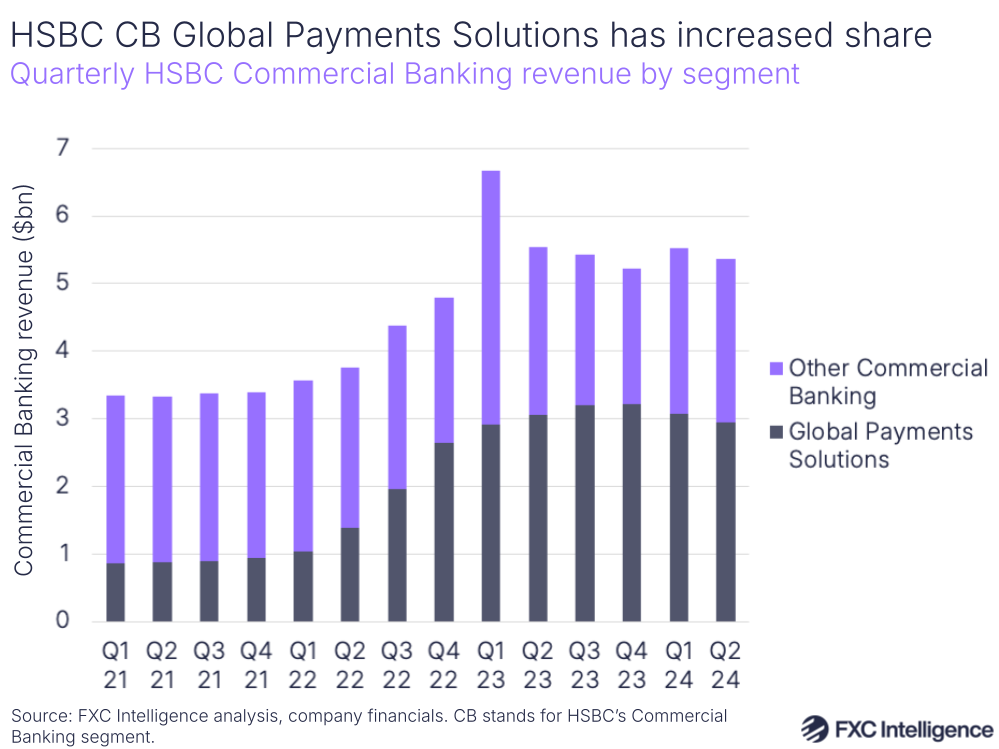
Global Payments Solutions has seen a similar trajectory within the Commercial Banking (CB) segment – at $2.9bn in Q2 24 it had a 55% share of Commercial Banking revenue and has also seen its share of the business unit increase significantly since 2021.
In Q2 2021, it accounted for 26% of Commercial Banking and as with its Global Banking and Markets counterpart saw a sharp increase in share across 2022.
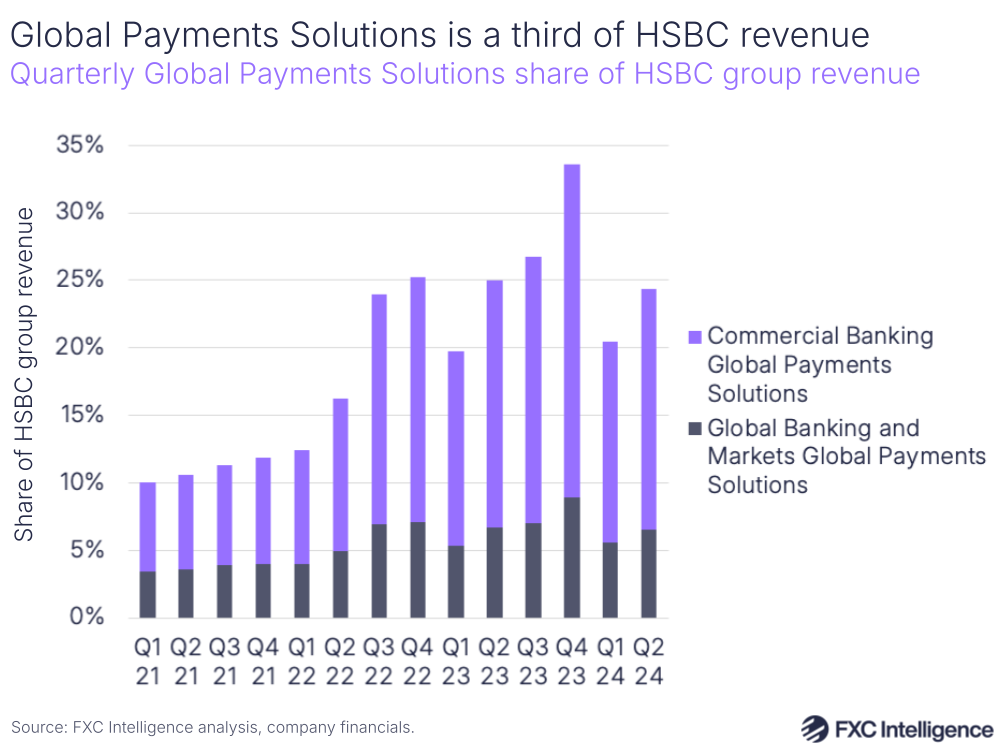
Combined, the two Global Payments Solutions segments represent a significant part of HSBC’s top-line revenue, accounting for 24% in Q2 2024 – 13 percentage points above Q2 2021’s share of 11%.
Over the past four quarters, their combined share has averaged 26% – a quarter of the entire group’s revenue.
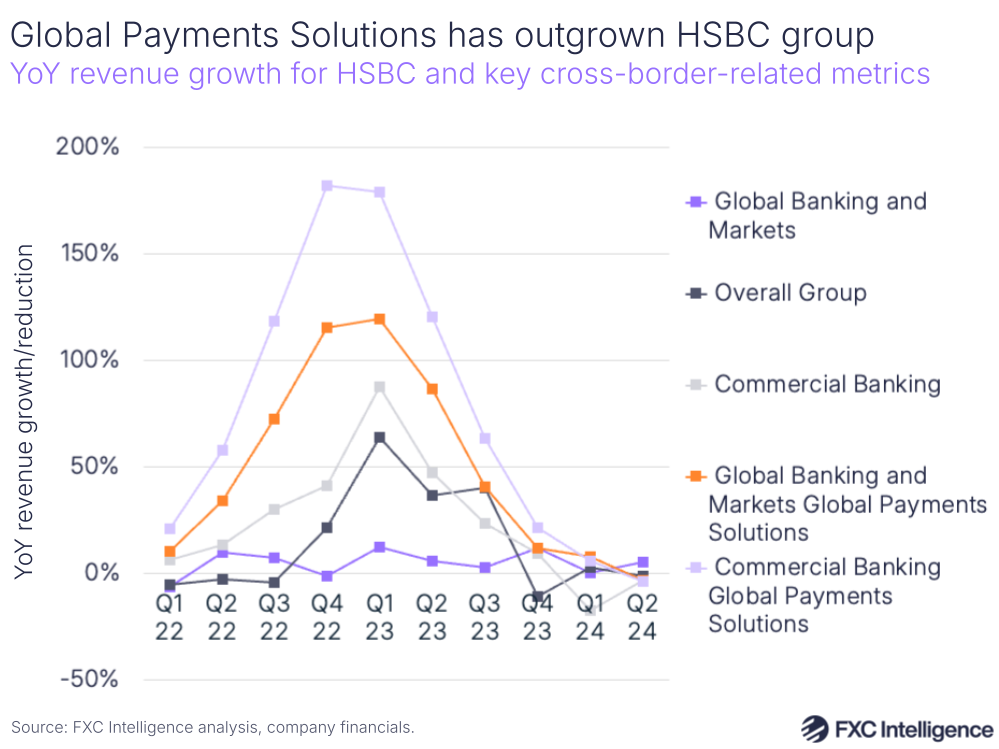
Given both segments’ gains in share, it is unsurprising to see that their YoY growth has significantly outpaced both their wider business units and HSBC as a whole, with both seeing very strong growth across H2 2022 and H2 2023.
However, both have seen a slight contraction in Q2 2024. In Global Banking and Markets this was attributed to margin compression, which offset increased fee revenue (which HSBC refers to as fee income). Meanwhile in Commercial Banking, HSBC reported that while Global Payments Solutions had also seen increased fee revenue as a result of higher payment volumes, as well as increased margins in some markets, it had faced currency volatility in both Argentina and Southeast Asia.
JPMorgan Chase
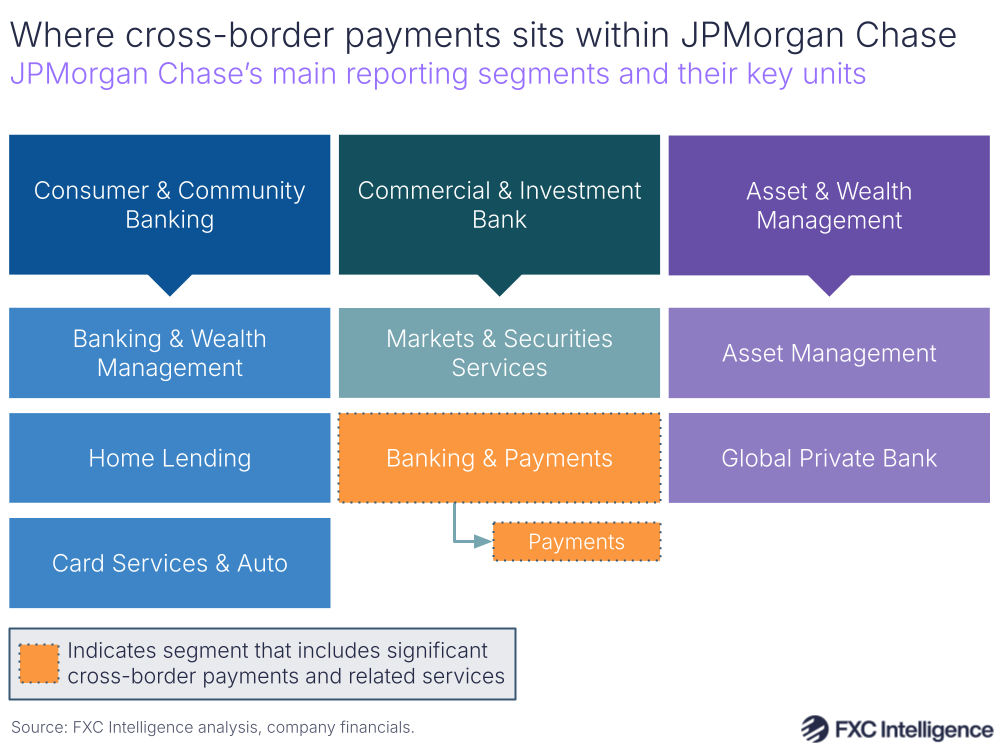
US banking giant JPMorgan Chase does not directly break out cross-border payments, nor does it mention it specifically in its earnings calls. However, it is best represented in its Payments unit, which forms part of the wider Banking & Payments segment of the company’s Commercial & Investment Bank (CIB) business.
This covers a wide range of solutions around payments acceptance, processing, fund management, cross-border and domestic payments, banking-as-a-service and blockchain. As a result, while cross-border is represented in part of this unit, is it unlikely to represent the majority of the revenue. JPMorgan’s payments processing segment, for example, is also likely to be a significant contributor.
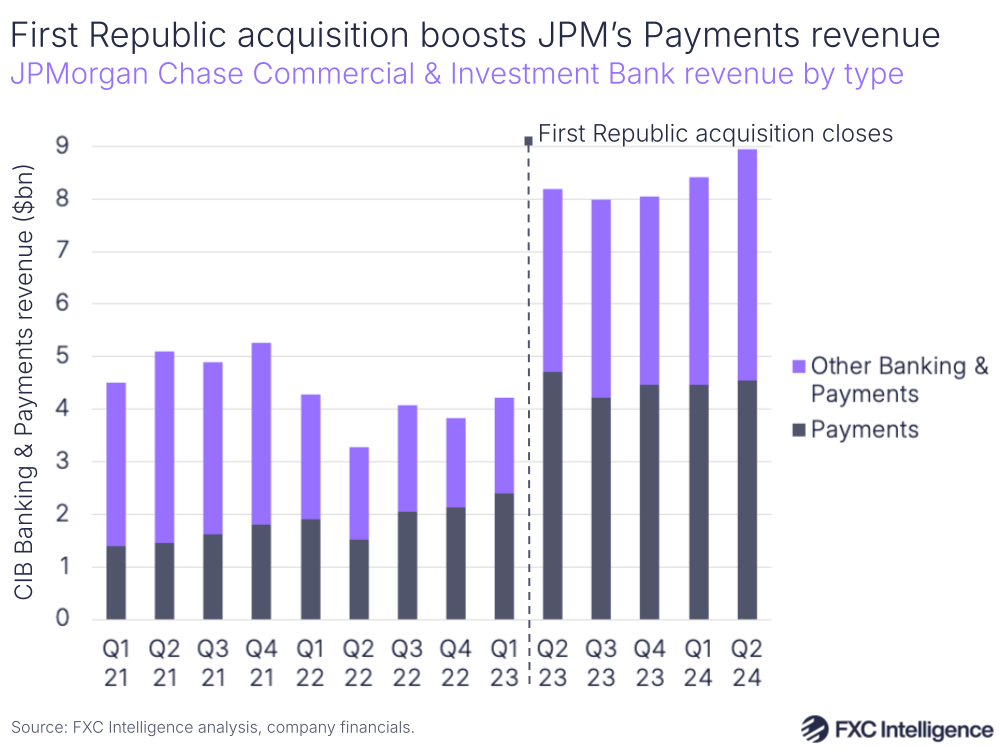
Both the Payments unit and the wider Banking & Payments segment that it sits under saw a significant uplift from Q2 2023 as a result of JPMorgan Chase’s acquisition of First Republic, a provider of personal, business and private wealth management banking services. This acquisition closed in May 2023, and meant that revised reporting for Q2 2023 onwards almost doubled both Payments revenue and the wider Banking & Payments segment.
While this makes displaying a time series of year-on-year revenue changes misleading, Q2 2024 data does enable a meaningful comparison since the addition of the First Republic contribution.
Here, Payments has seen revenue reduce by -4% YoY to $4.5bn, which JPMorgan attributes to a compression in deposit margin and higher deposit-related client credits. However, it did also report a growth in fees, which may include those contributed by cross-border payments, with commissions and other fees seeing an 8% YoY increase.
By contrast, the wider Banking & Payments unit saw 9% YoY growth, as did the overall Commercial & Investment Bank segment, while JPMorgan Chase overall saw revenue increase by 22% in Q2 2024.
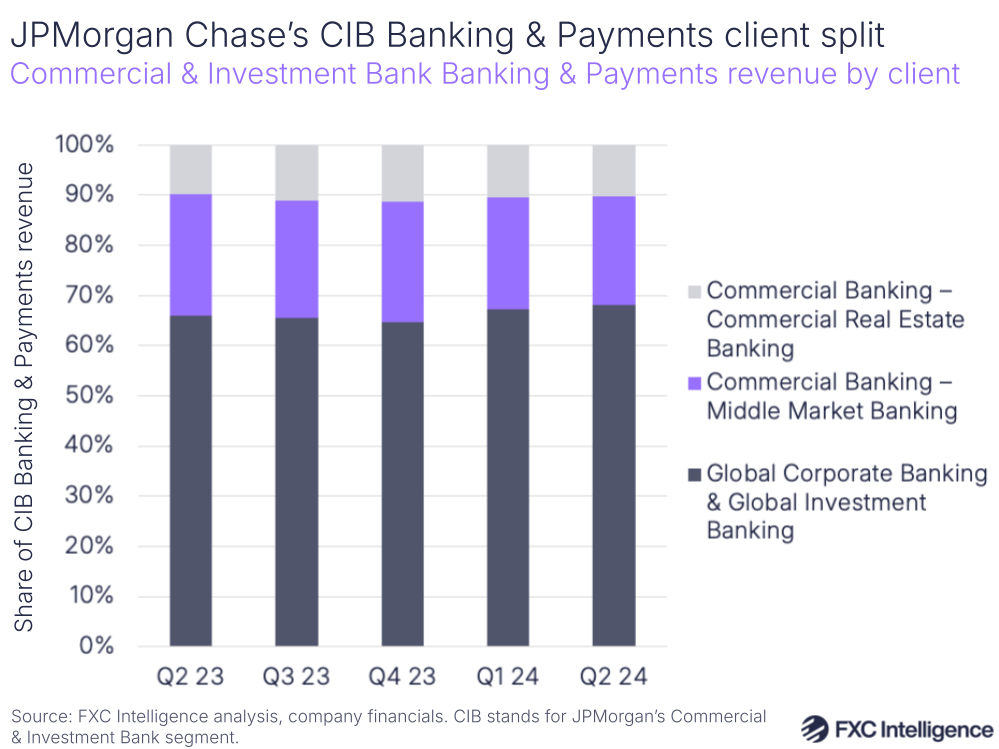
Updated data following the acquisition also provides an insight into the types of clients that the Payments unit caters to, with around 68% of revenue coming from the company’s Global Corporate Banking & Global Investment client coverage segment in Q2 2024.
This represents the company’s largest clients, providing banking products and services to large corporations, merchants and financial institutions who are likely to have greater cross-border needs than smaller organisations. However, it will also include revenue from the company’s payments processing business rather than being uniquely from domestic and cross-border B2B or B2C payments.
Commercial Banking overall accounted for the remaining 32%, with 68% of this segment covered by Middle Market Banking – which includes mid-sized companies, local governments and municipalities – while 32% is Commercial Real Estate Banking.
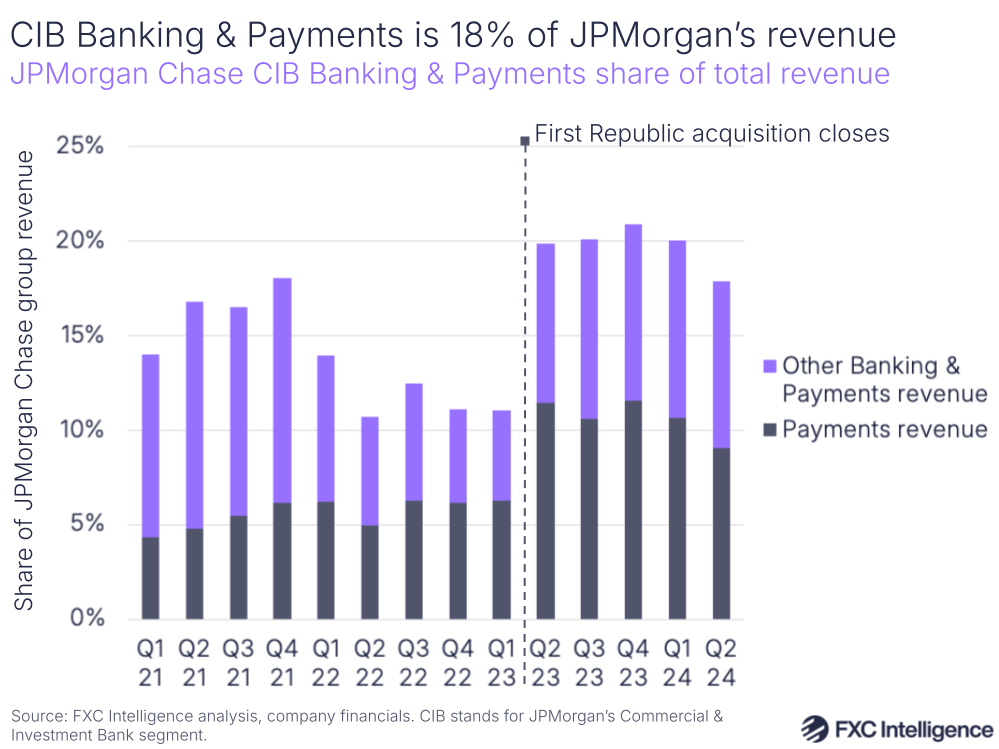
Banking & Payments accounted for 18% of JPMorgan Chase’s overall revenue in Q2 2024, while Payments alone accounted for 9%. However, the acquisition of First Republic has helped drive this upwards.
In Q1 2023, Banking & Payments accounted for 11% of JPMorgan Chase revenue, while Payments alone accounted for 6%.
Get in touch to find out how we can support your cross-border payments strategy
NatWest
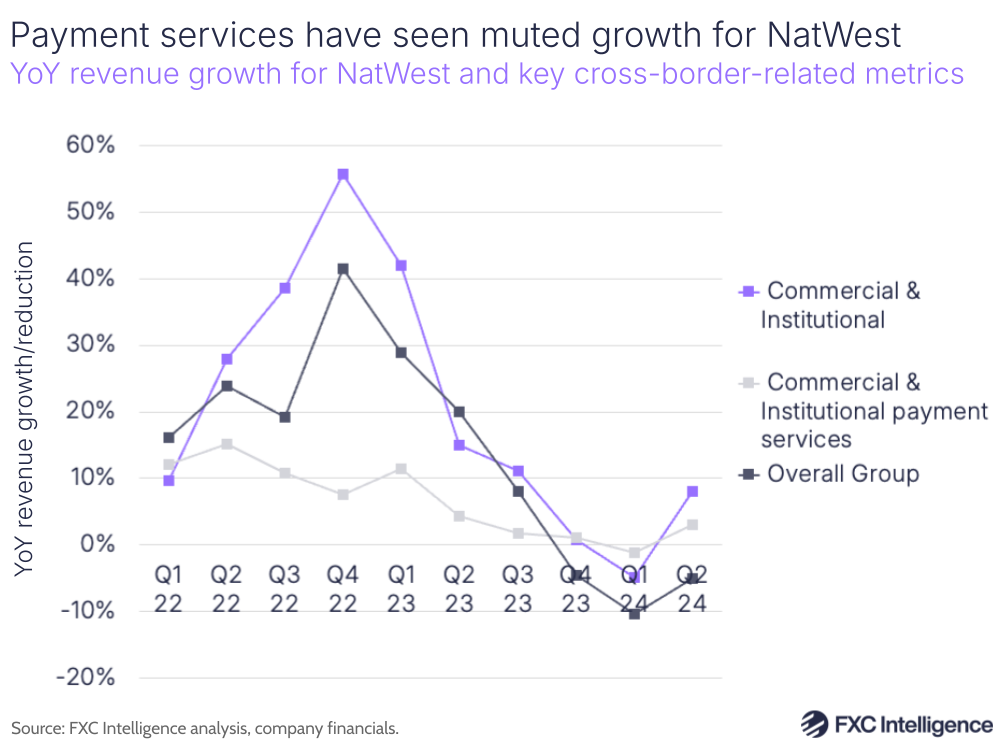
UK-headquartered retail and commercial bank NatWest does not break out any cross-border payments numbers directly, but does report payments services as part of a breakout of fee revenue (which NatWest refers to as fee income) in its Commercial & Institutional (CI) segment.
While this is likely to include some domestic payments, NatWest’s payments services discussed on its website largely focus on cross-border payments services. For its Corporate & Institutions customers, the company offers currencies, FX risk management and FX prime brokerage services. Meanwhile, the company offers a more pared-down cross-border payments service for its Business customers via both its Bankline digital banking platform and its standard Online Banking platform, charging a flat fee of £15 a transaction plus an FX margin for most currencies.
As a result, the reporting of payments services in Commercial & Institutional is likely to cover all three of the reporting units in this segment, namely Business Banking, Commercial Mid-Market and Corporate & Institutions.
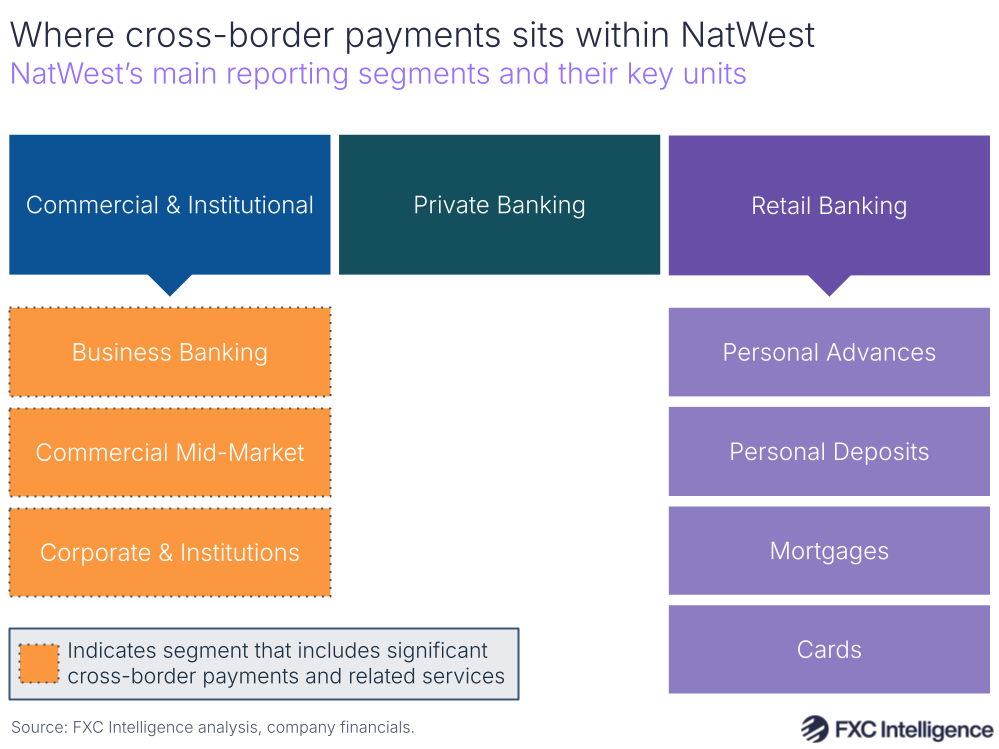
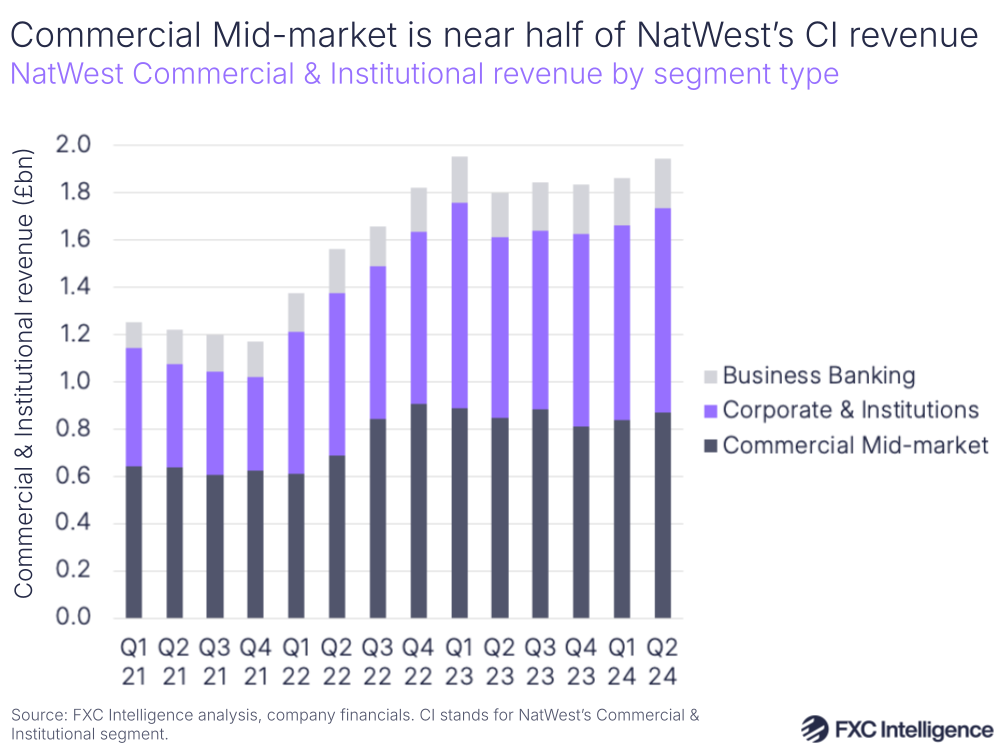
In terms of revenue, Business Banking is the smallest segment, accounting for 10.8% of all Commercial & Institutional revenue in Q2 2024, while Commercial Mid-Market accounted for 44.7% and Corporate & Institutions accounted for 44.5%.
This share split has remained fairly consistent over the last few years, although Corporate & Institutions has taken some share from Commercial Mid-Market: in Q2 2021 the former had a 36% share while the latter had a 52% share.
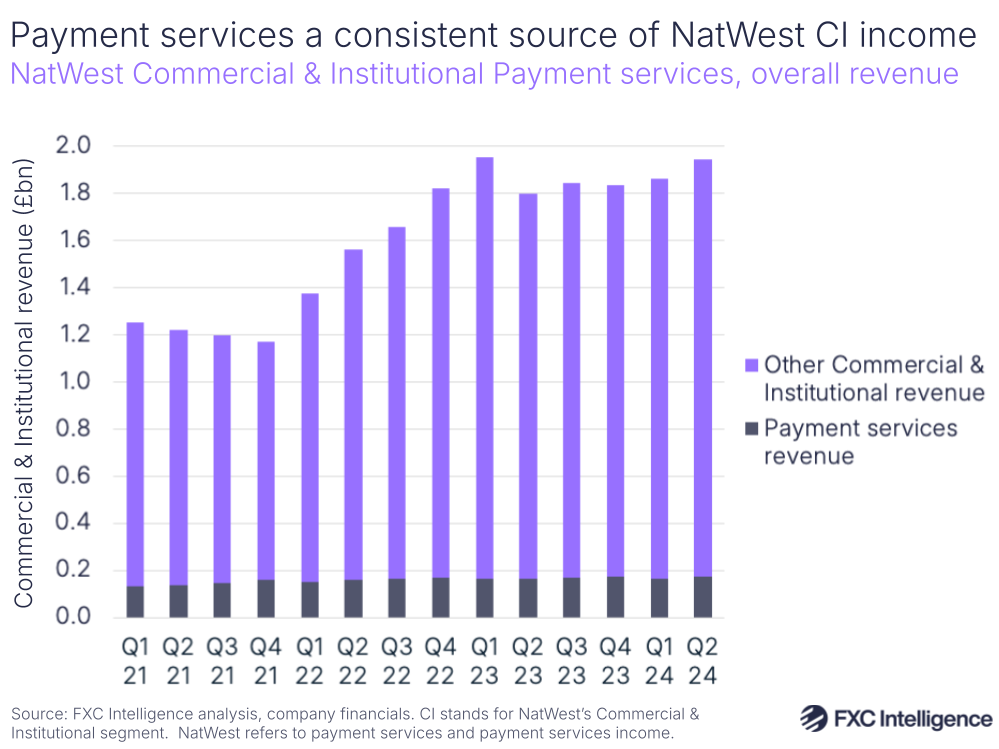
Payment services revenue (which NatWest refers to as payment services income), meanwhile, has remained relatively consistent throughout the past few years, seeing modest but fairly consistent growth each quarter.
As a result, its share of the overall segment’s revenue has reduced over time, particularly as a changing interest rate environment has helped drive up net interest revenue (reported as net interest income). While in Q2 2021 payment services had an 11% share of Commercial & Institutional revenue, this had dropped to 9% in Q2 2024.
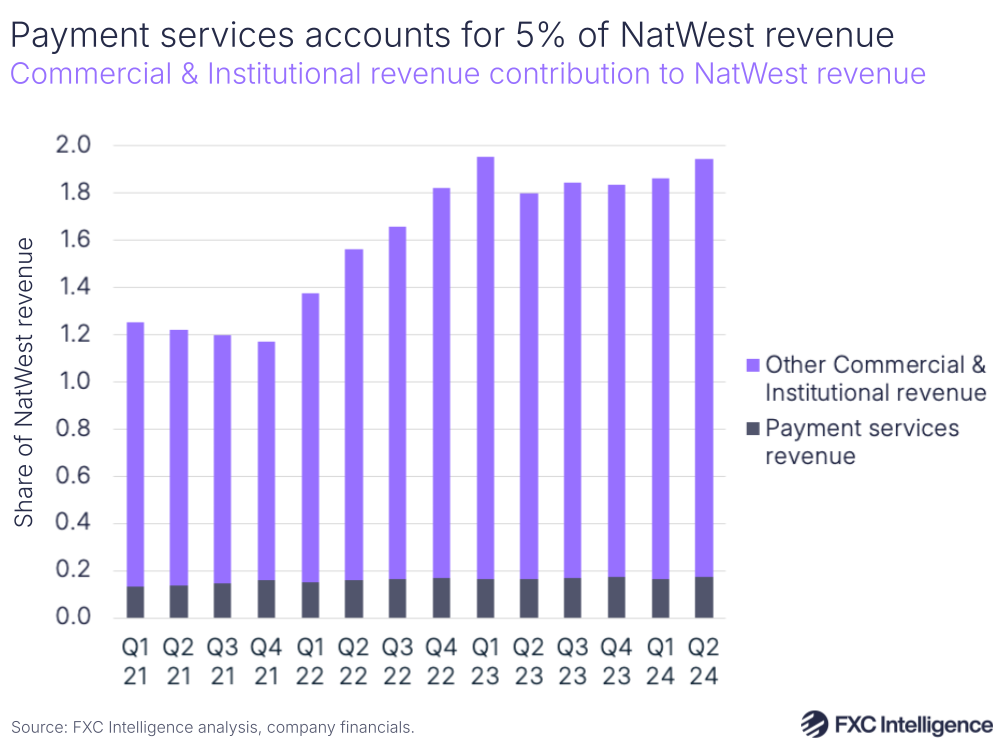
However, payment services revenue remains a fairly strong contributor to NatWest’s top-line revenue, accounting for 5% in Q2 2024 – a share that it has had almost every quarter for the past two years.
Meanwhile, the Commercial & Institutional segment overall accounted for 53% of all NatWest revenue in Q2 2024, up from 47% in Q2 2021.
Looking at year-on-year growth, payment services has seen its rate of growth slow over the past few years. While in 2022 it averaged YoY growth of 11%, this dropped to 5% in 2023, and in Q1 2024 it saw its first contraction during the period, of -1.2% YoY. Q2 2024 has seen this return to 3% growth, however.
Meanwhile Commercial & Institutional revenue saw periods of strong growth in 2022, although saw more pronounced reductions in Q1 2024, while the overall group has reported YoY declines in the last three quarters.
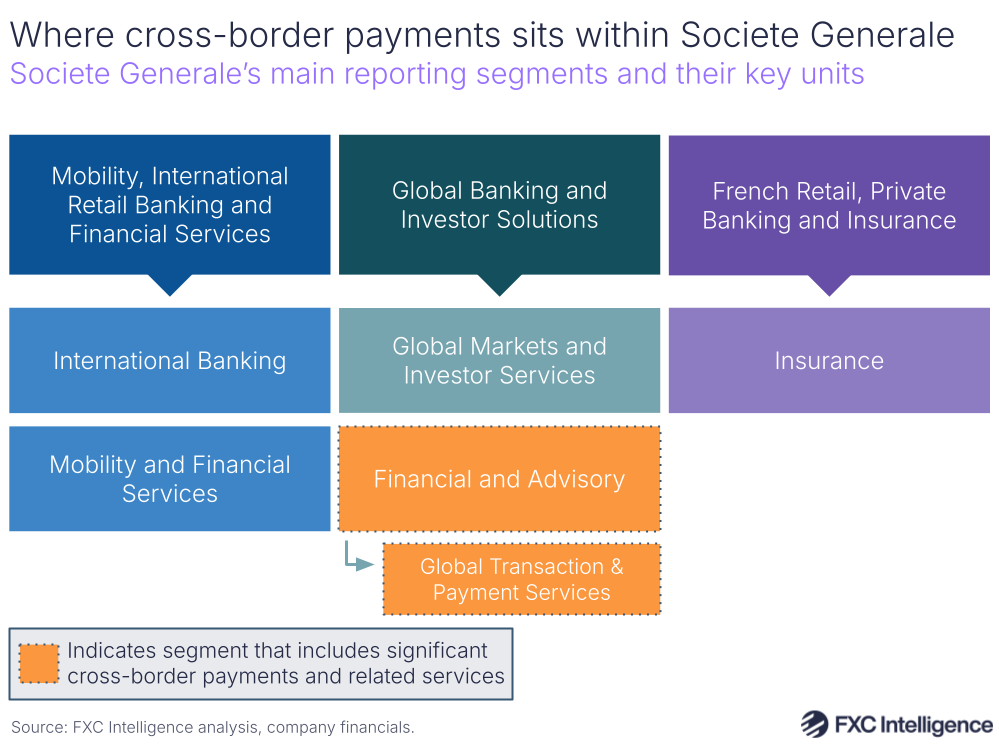
Societe Generale
French-headquartered Societe Generale publishes little direct financial data about the performance of its main cross-border offering, however the performance of the wider relevant unit does provide some insights.
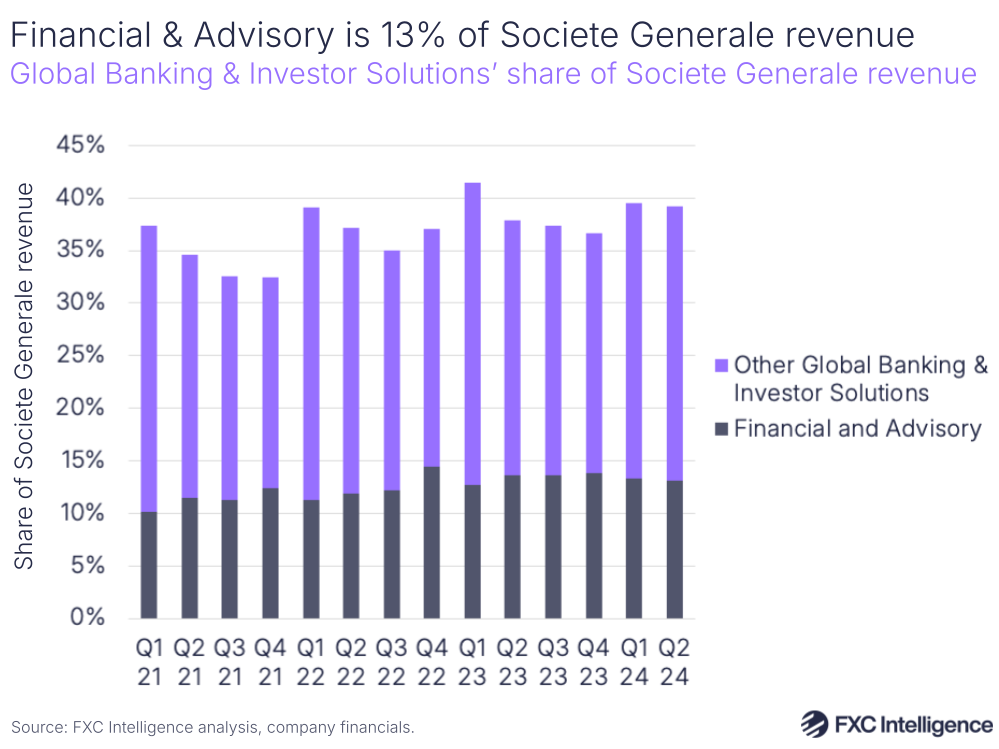
The company provides transaction banking services that include domestic and cross-border payments and related solutions through its Global Transaction & Payment Services division. While the company does not directly report revenue on this division, it does provide updates on its performance as part of the wider Financial & Advisory unit, which itself is a part of Societe Generale’s Global Banking & Investor Solutions business segment – one of three that make up the company’s operations.
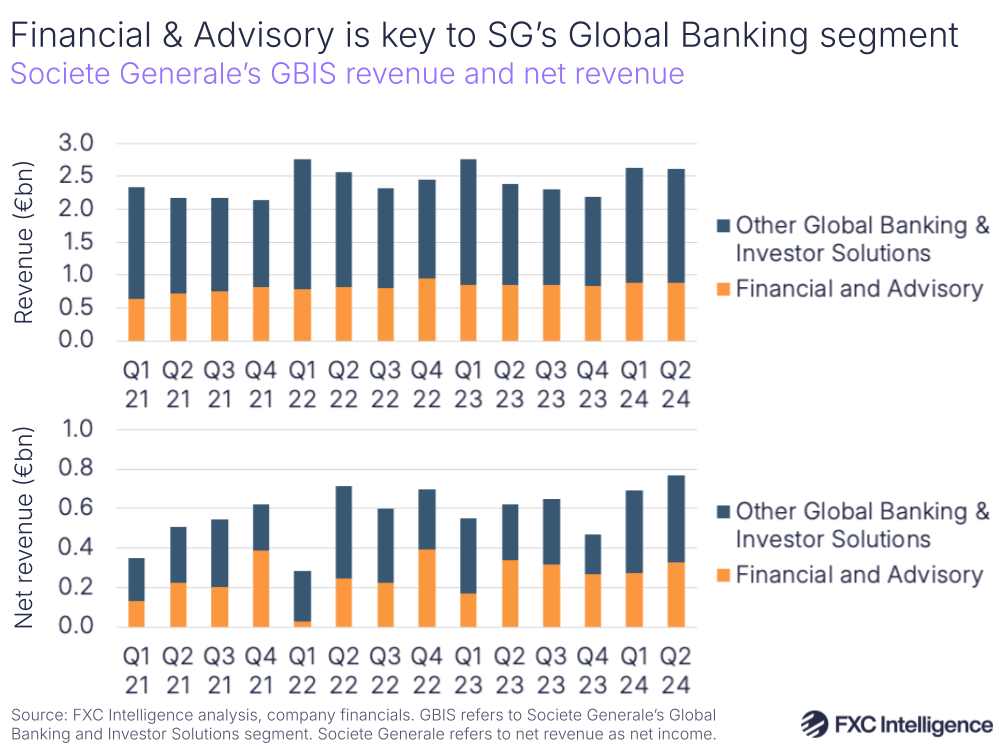
The Financial and Advisory unit accounted for 34% of Global Banking & Investor Solutions (GBIS) revenue in Q2 2024, having maintained around this share for the past two years. In terms of net revenue (reported by Societe Generale as net income), the unit is an even stronger contributor, accounting for 42% in Q2 2024.
This segment’s revenue is contributed to by transaction banking, and therefore some measure of cross-border payments, but there are also other factors driving its growth, with recent investment performance noted as one of the key drivers in the most recent quarter.
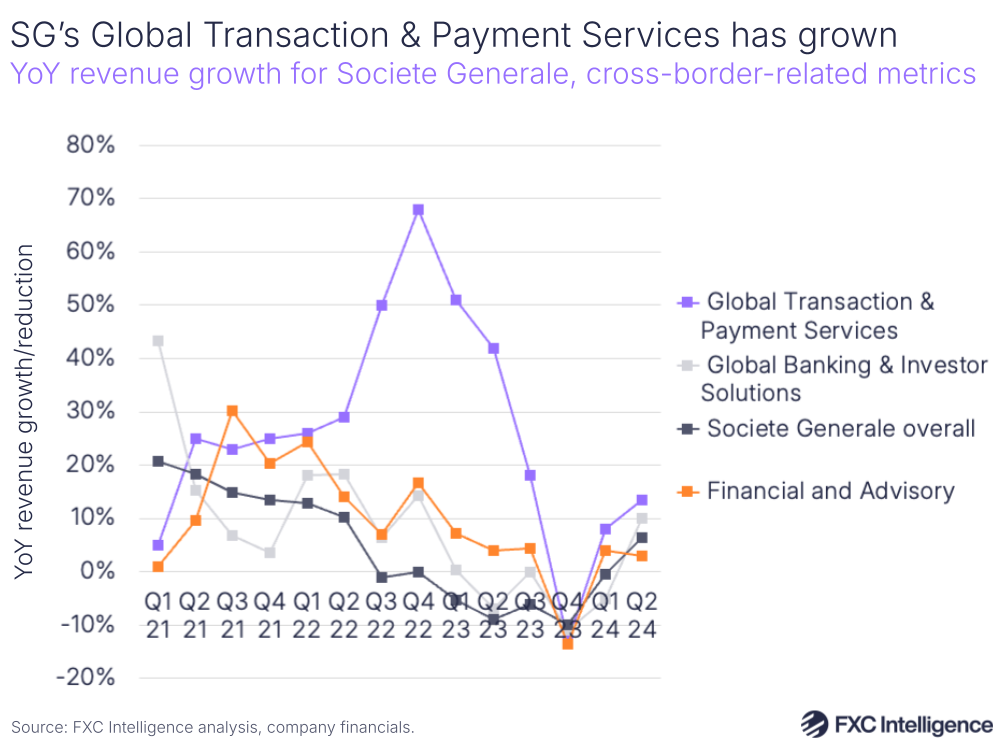
While Societe Generale does not put out direct financial numbers for Global Transaction & Payment Services, it does report YoY revenue growth for the division each quarter, noting in Q2 2024 that it had seen favourable market conditions and strong commercial development that had contributed to a 13.5% increase in revenue.
In most quarters of the past few years, Global Transaction & Payment Services has outperformed its wider segment in regards to growth, particularly across late 2022 and early 2023. However, while both the overall company and the Global Banking and Investor Solutions segment saw a drop into negative growth in late 2023, 2024 has so far produced a return to growth across the board.
While it is not clear how much revenue Global Transaction & Payment Services contributes to Financial & Advisory, the wider unit is fairly key to the wider company, contributing 13% of all revenue in the latest quarter, while the Global Banking & Investor Solutions segment as a whole contributed 39%.
Both are particularly key to net revenue, with Financial & Advisory contributing 29% and Global Transaction & Payment Services contributing 69%.
Standard Chartered
Standard Chartered, another UK-headquartered bank with a strong Asian presence, is by far the most transparent about the revenue contribution of its cross-border business out of all the companies looked at for this report.
The company places its cross-border offering as central to its positioning, with Group Chief Executive Bill Winters describing the company as “delivering exceptional cross-border services to the world’s most sophisticated entities and individuals” in his opening remarks to investors in Q2 2024. The company’s cross-border business, which it previously referred to as network, is also mentioned throughout its recent earnings report and supporting materials.
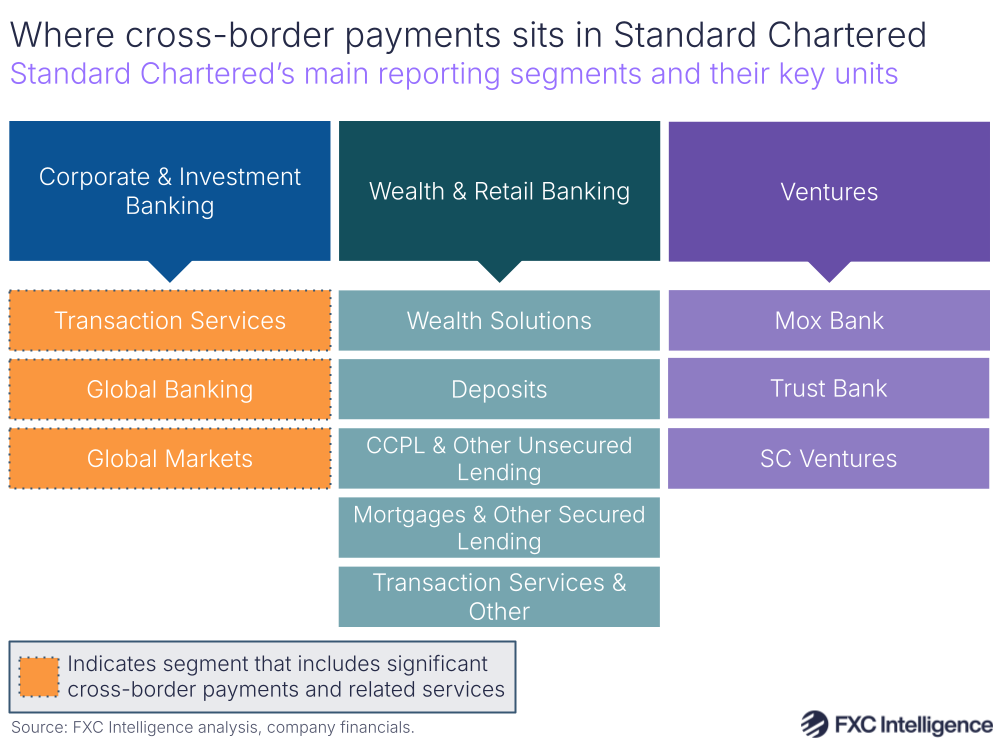
While Standard Chartered does not report cross-border revenue every quarter, it has provided an update every half-year, as well as providing additional insights into how this divides across the business in its most recent release. Cross-border payments does not sit just within one unit, but instead contributes to three – Transaction Services, Global Banking and Global Markets – which together form the company’s top-level Corporate & Investment Banking (CIB) segment, formerly known as Corporate, Commercial & Institutional Banking. This is one of three primary segments that make up Standard Chartered, with Wealth & Retail Banking and Ventures being the other two.
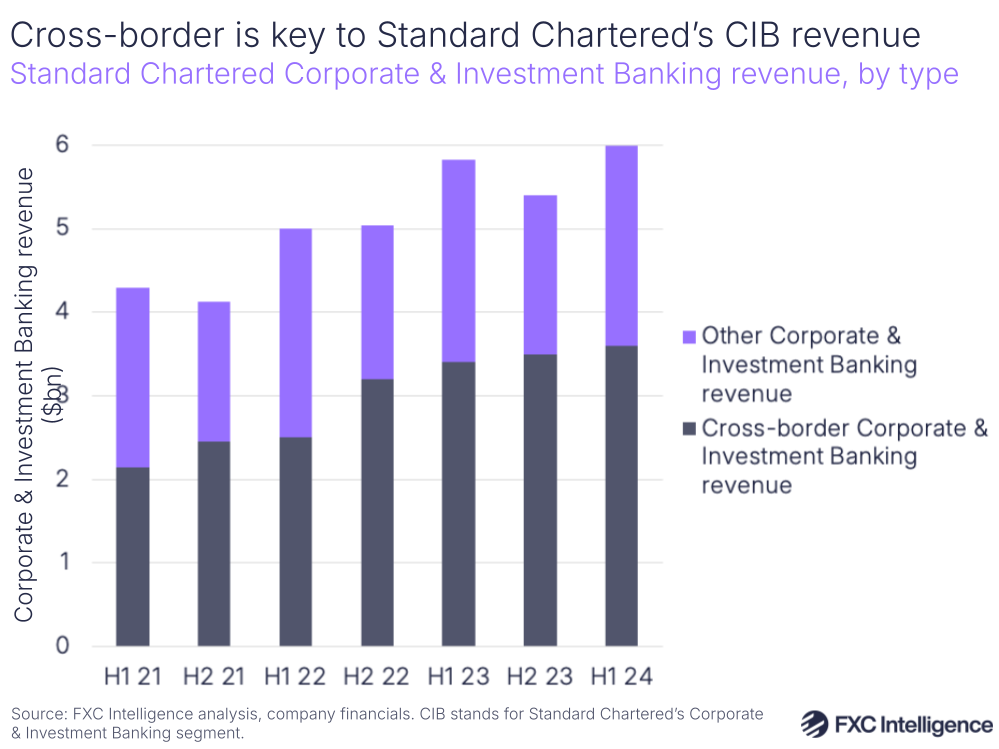
Within Corporate & Investment Banking, cross-border payments is extremely significant. In H1 2024, cross-border revenue totalled $3.6bn – 60% of the overall segment’s $6bn revenue for the quarter.
This follows a 65% share in H2 2023 and a 58% share H1 2023, although cross-border revenue has seen growth each year. However, it does represent a significant improvement on previous years, with cross-border having accounted for 50% of the segment’s revenue in 2019 and having seen an 11% CAGR since then.
For FY 2023, cross-border revenue totalled $6.9bn, a 31% YoY increase, while Corporate & Investment Banking saw revenue total $11.2bn overall.
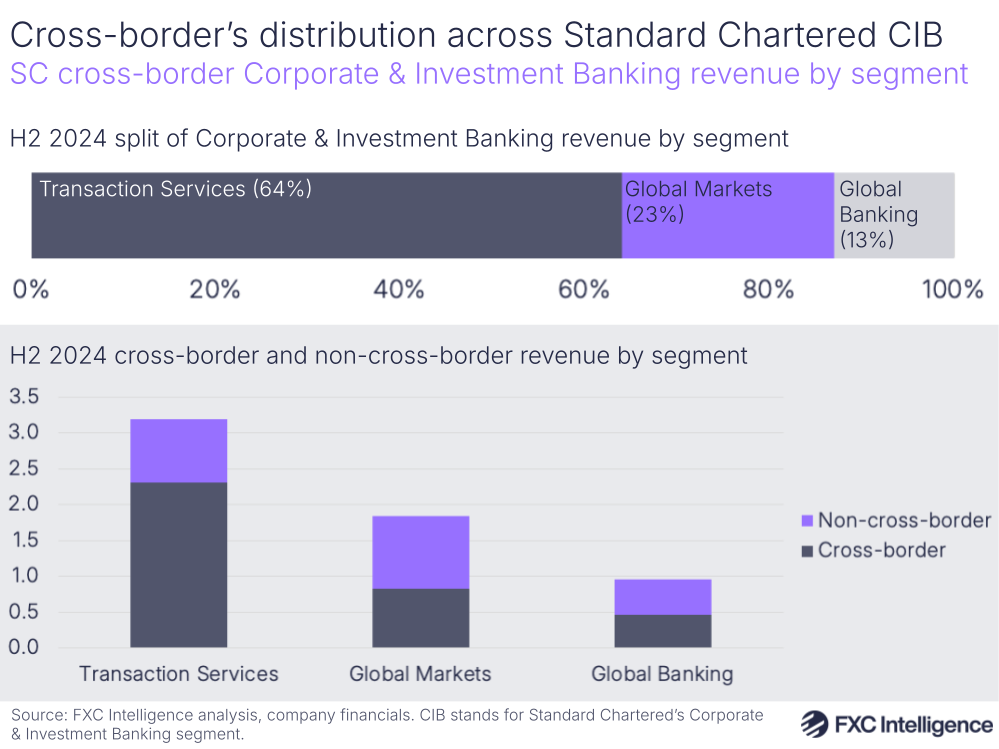
The most recent release of data also included a breakdown of how cross-border is split across the three units within Corporate & Investment Banking. The majority comes from Transaction Services, which accounts for 64%, while 23% is from Global Markets and 13% is from Global Banking.
This means that as of H2 2024, 72% of Transaction Services revenue was cross-border, though it is also a significant contributor to both other segments. In the same period, 45% of Global Markets and 49% of Global Banking revenue was cross-border, with much of the company’s cross-border flows in Global Markets coming from either digital channels or via cross-selling.
Across the segment, Standard Chartered’s Asia focus is critical to its cross-border proposition, with Winters describing the company as “uniquely positioned to capture the opportunities arising from increasing fragmentation of supply, trade and investment flows”. Around a third of the company’s cross-border revenue (which it refers to as cross-border income) is now intra-Asia, and it has reported particularly strong revenue growth from China to Association of Southeast Asian Nations (ASEAN) corridors. In H2 2024, the company reported China-ASEAN cross-border revenue growth at 11%, while in H1 2023 it was 82%, with cross-border revenue from China overall growing 59% in the same period.
Standard Chartered also reports that its cross-border revenue is delivering higher returns than the Corporate & Investment Banking segment division overall. It reports cross-border as seeing a revenue return on risk-weight asset – which is reached by dividing cross-border revenue by cross-border risk-weight asset – in H1 2024 of 9.7%, compared to the overall division’s c. 8.1%.
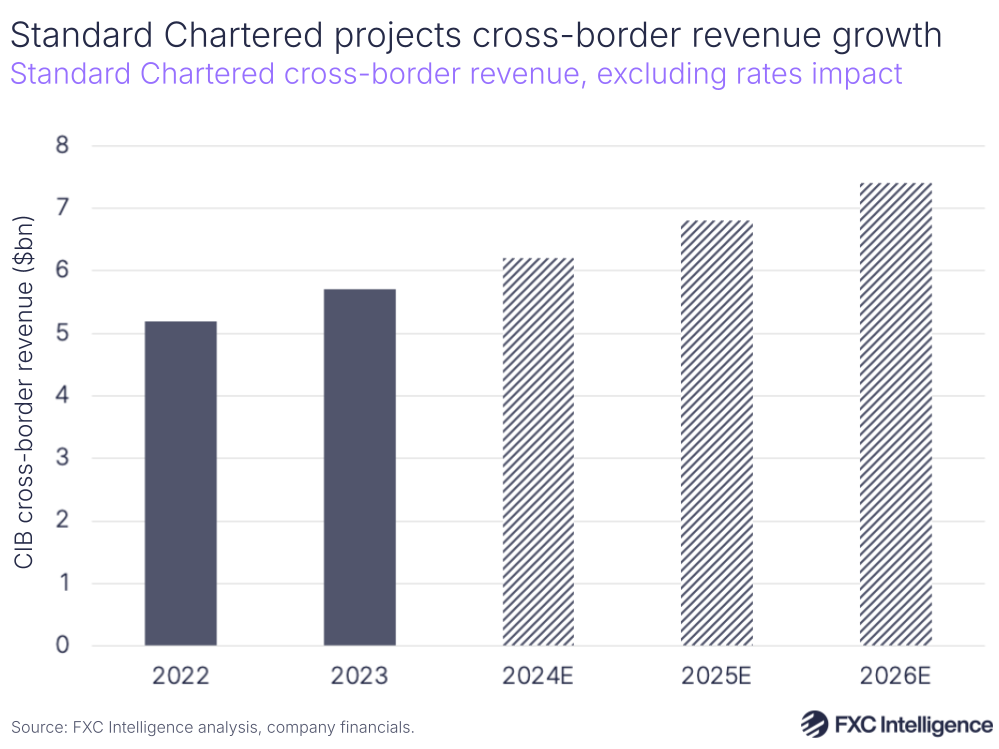
Standard Chartered also provides growth projections for the cross-border revenue line for the next few years, based on cross-border revenue, excluding rates impact. This metric reached $5.7bn in 2023, a 9% increase on 2022, however Standard Chartered projects that it will see growth of 8-10% each year from now until 2026.
Assuming a mid-point growth rate of 9% each year, this would see it reach $7.4bn in revenue excluding rates impact in 2026.
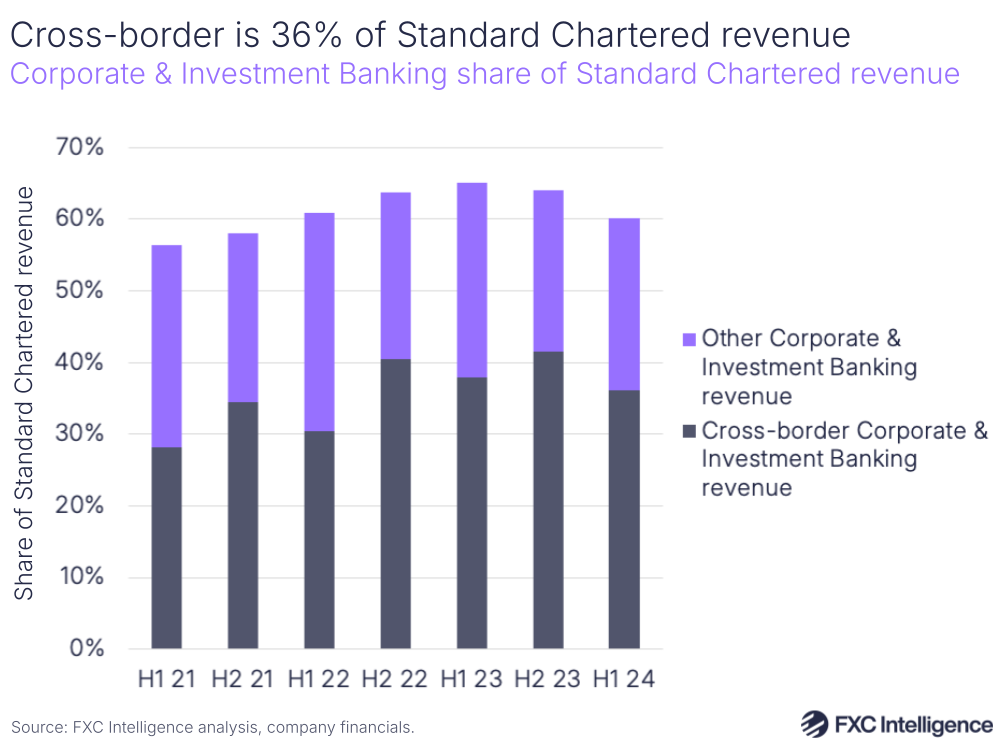
While cross-border is a key part of the Corporate & Investment Banking segment’s revenue, it is also a key contributor to Standard Chartered overall. In H1 2024, Corporate & Investment Banking as a whole accounted for 60% of Standard Chartered revenue, while cross-border alone accounted for 36% – more than a third of the company’s revenue.
This is slightly down from a peak of 42% in H2 2023, but it has not dropped below 30% since 2021.
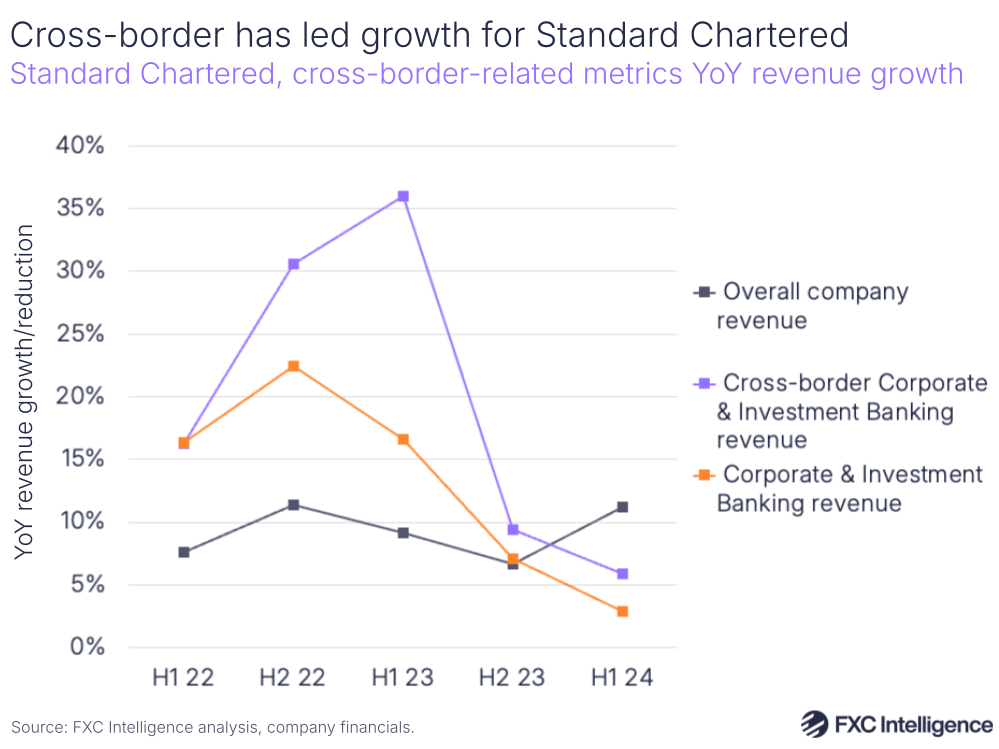
While Corporate & Investment Banking, cross-border and Standard Chartered overall have all consistently seen positive YoY growth for the past few years, cross-border has generally outperformed the wider group.
H2 2022 and H1 2023 saw the strongest growth for cross-border, at 31% and 36% YoY respectively, with H2 2023 and H1 2024 seeing more muted growth rates of 9% and 6%. Corporate & Investment Banking as a whole, meanwhile, has followed the growth shape, but has seen less pronounced growth each quarter, indicating that non-cross-border revenue in the division is seeing slower growth.
The overall Standard Chartered group, meanwhile, has for the most part seen more muted growth, although did report an 11% YoY increase in H1 2024.
UBS
Switzerland-headquartered UBS does not directly discuss cross-border payments in its earnings, and does not break out its key offerings in this space within its earnings directly, however there are some metrics that provide a sense of the company’s performance in this area.
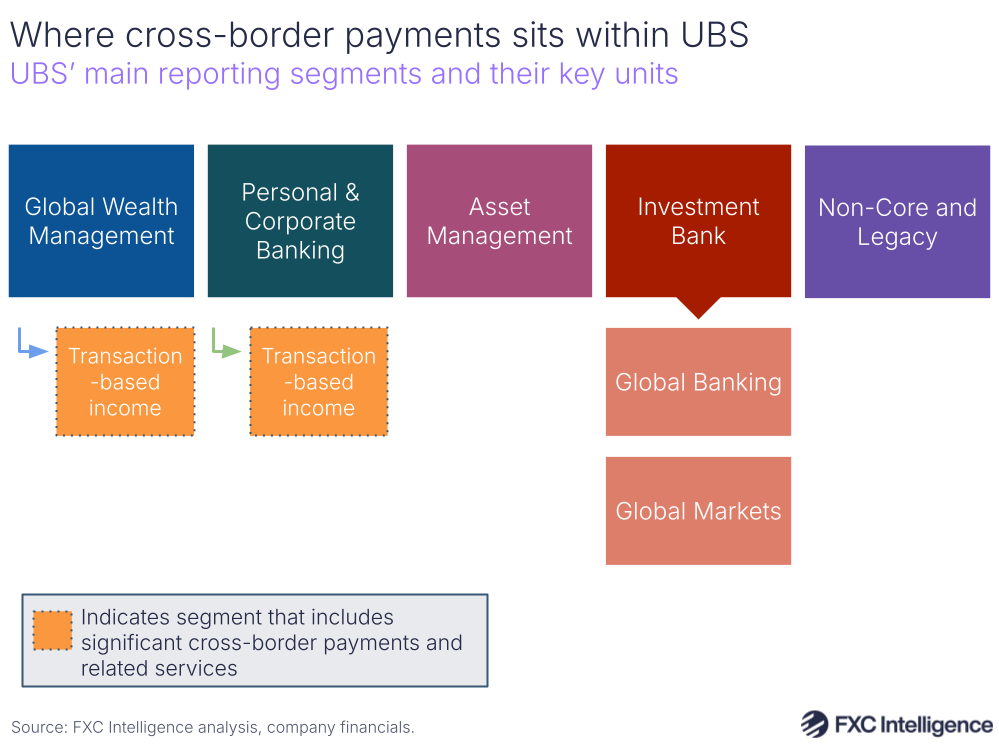
UBS details its corporate cross-border payments offering as part of a range of Foreign Business solutions, with products covered in this area including hedging currency risks, international payments transactions in more than 120 currencies and trade and export finance. These services are provided under the company’s Personal & Corporate Banking segment, one of five that cover the full business, and are likely to be reported as transaction-based revenue (referred to by the company as transaction-based income) – although this will also include some domestic transactions.
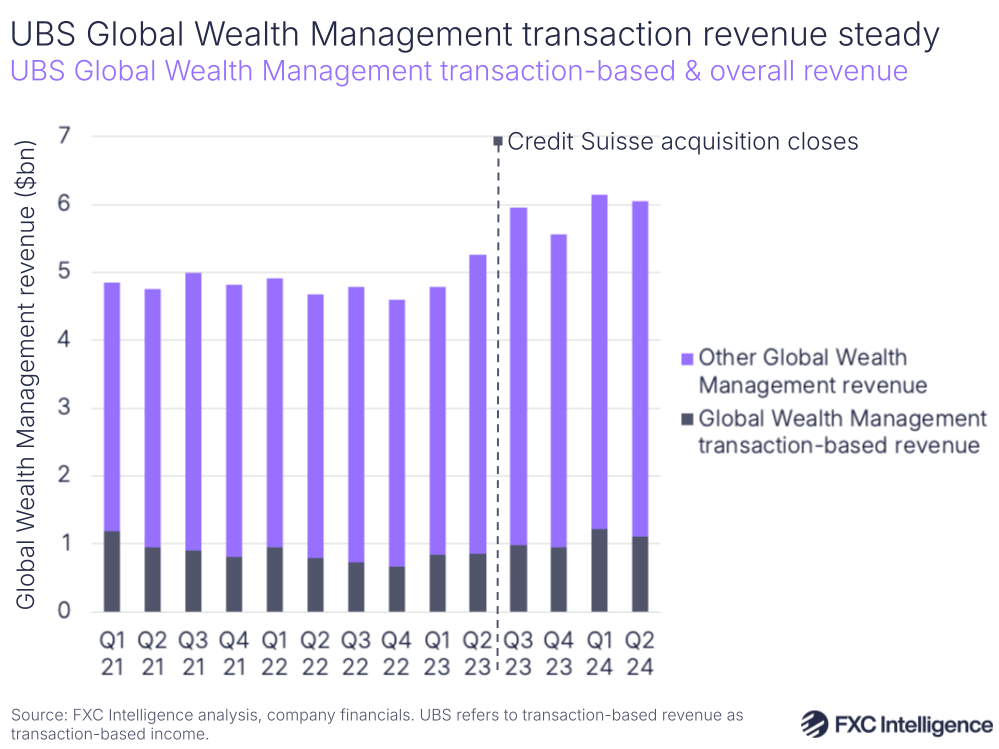
The company also offers a similar service under its Global Wealth Management segment, which is also reported as transaction-based revenue, however this is designed for entrepreneurs, family offices and ultra-high net worth (UHNW) individuals.
While UBS does have a Global Banking unit, a term used by other banks to denote their cross-border payments and related services, for UBS this sits under its Investment Bank segment and focuses on providing clients with advice and access to international mergers and acquisitions.
Looking at revenue largely generated by corporate clients, transaction revenue reported under the Personal & Corporate Banking segment accounted for 22% of the overall segment’s revenue in Q2 2024, although accounted for as much as 30% in Q1 2022.
The wider Personal & Corporate Banking segment saw a 4% sequential reduction overall in Q2 2024, although this was driven by an 8% reduction in net interest revenue (reported as net interest income), with the company pointing to growth in transaction-based revenues as a key offset.
An upswing in both segment revenue and transaction-based revenue in 2023 was likely in part due to the acquisition of Credit Suisse, which UBS acquired in mid-2023. While UBS has not explicitly detailed where every line of the former Credit Suisse business is within its current reporting structure, the bank has traditionally had a similar structure to UBS and it appears that synergistic segments have largely been incorporated as part of the acquisition.
As Credit Suisse had a similar corporate cross-border payments offering to UBS, it is therefore likely that this has been incorporated into the Personal & Corporate Banking unit and reported as part of transaction-based revenue.
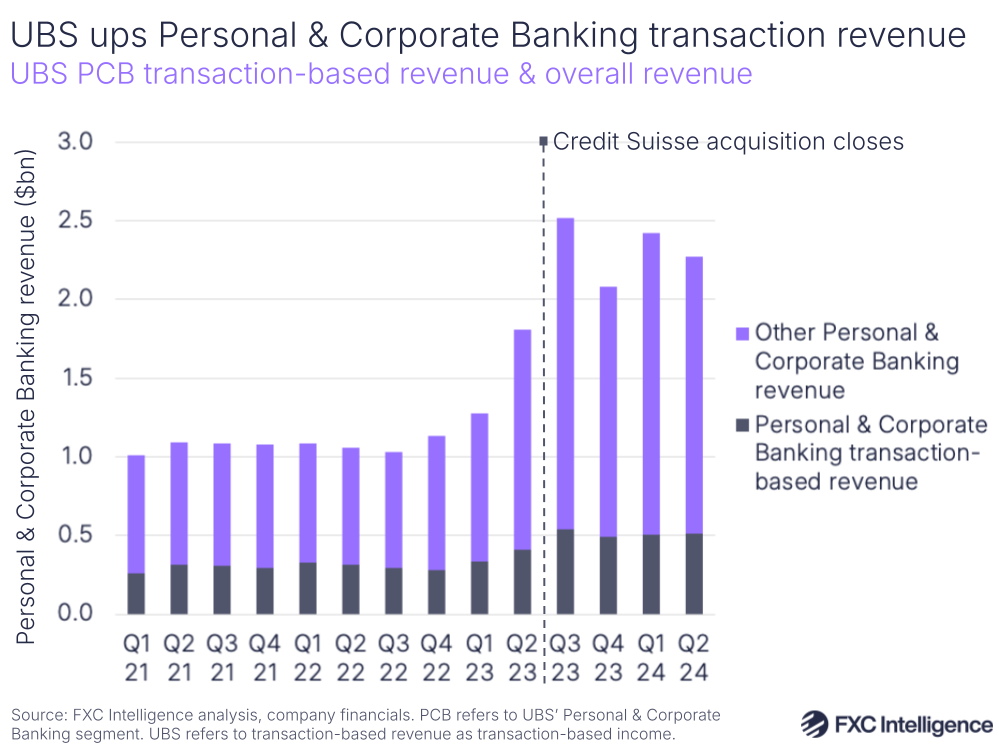
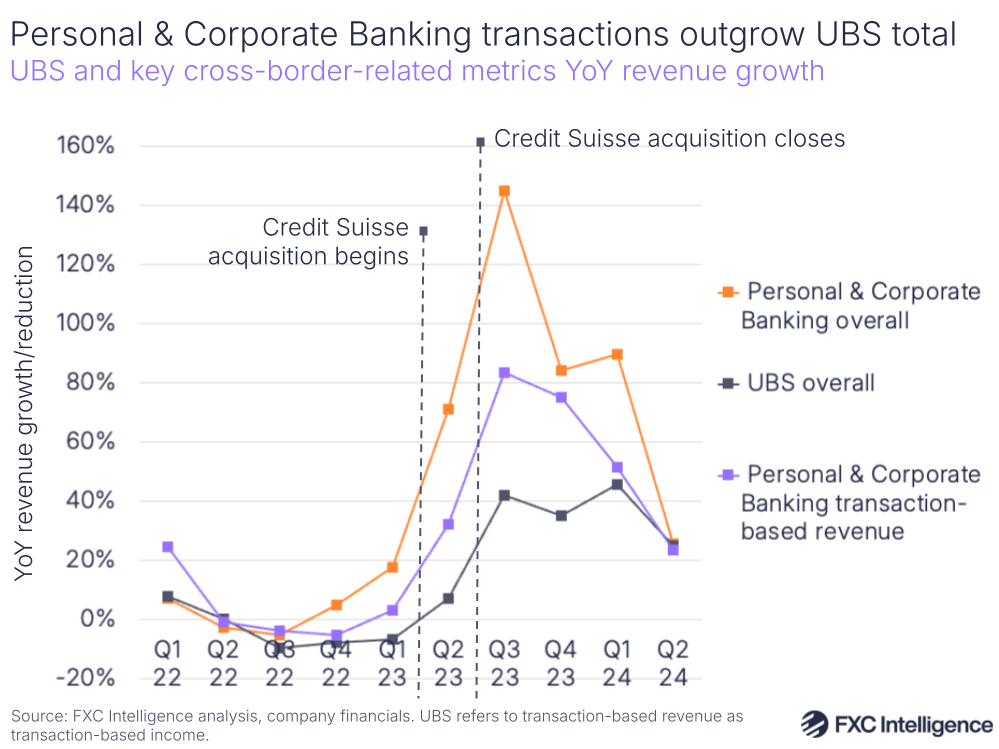
This is reflected in the YoY growth that this unit has seen over the past few years. Transaction-based revenue in Personal & Corporate Banking and Personal & Corporate Banking overall saw similar YoY growth to UBS at large in Q2 2024, seeing 24%, 26% and 25% YoY growth respectively. However, all three saw particularly elevated YoY growth across 2023, starting from Q2 2023 when the acquisition began but with the biggest YoY gains in Q3 2023 when it was completed.
Having seen a three-quarter run of YoY declines, UBS overall saw a return to growth in Q2 2023 at 7% YoY followed by 42% growth in Q3 2023. However, Personal & Corporate Banking saw a far more pronounced version of this, with Q2 2023 seeing growth of 71% YoY and Q3 2023 seeing a 145% jump. Transaction-based revenue followed this line, albeit less strongly, with a 32% YoY increase in Q2 2023 and 83% in Q3 2023.
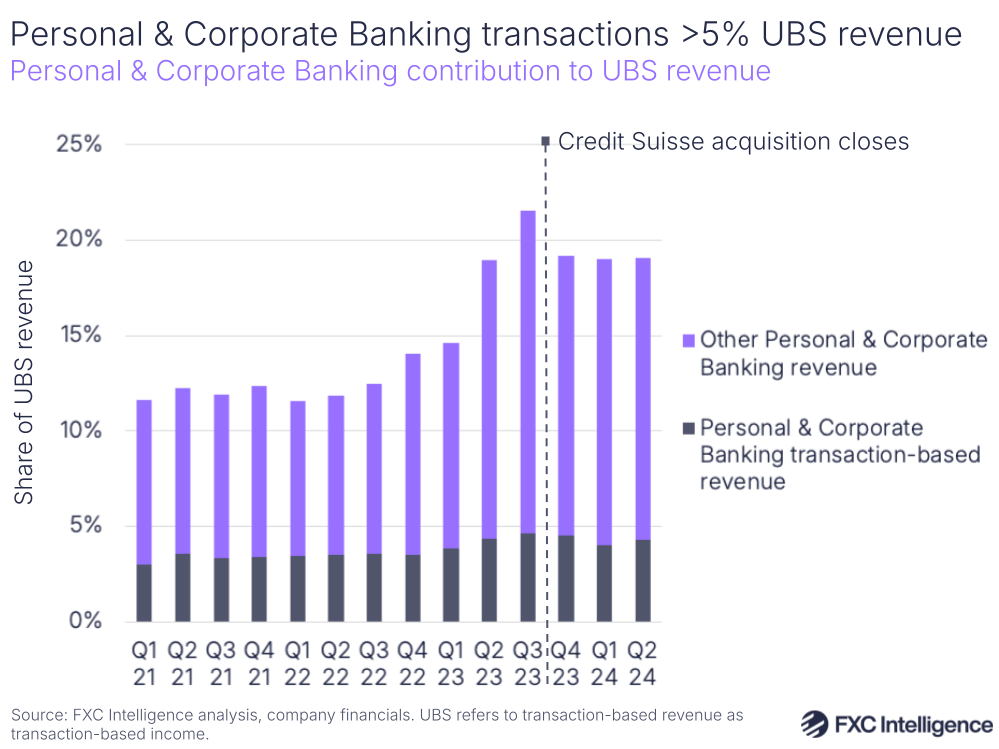
On revenue contribution, the company’s transaction-based revenue from its Personal & Corporate Banking segment accounted for 4.3% of all UBS revenue as of Q2 2024. It has retained this share fairly consistently over the past few years, although saw its share reach a high of 4.6% in Q3 2023.
Personal & Corporate Banking overall, meanwhile, accounted for 19% of UBS revenue in Q2 2024, having seen its highest share in Q3 2023 when it accounted for 22%.
Looking to entrepreneur and UHNW-focused reporting, transaction-based revenue accounted for 18% of the wider Global Wealth Management segment in Q2 2024, although it accounted for as much as 24% at the start of 2021.
Here, transactional activity was described as having “strong momentum” in the latest quarter; however there is less of a jump following the Credit Suisse acquisition, suggesting that although the company has said that this segment has retained Credit Suisse’s invested assets, there was little addition to its cross-border offering in this unit.
Wells Fargo
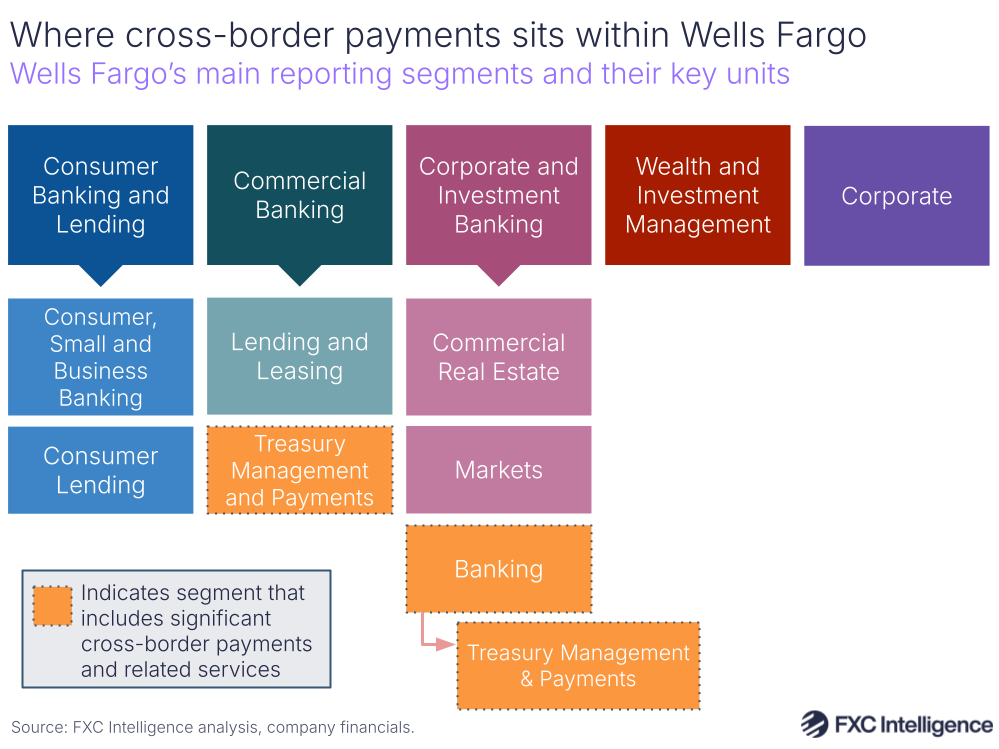
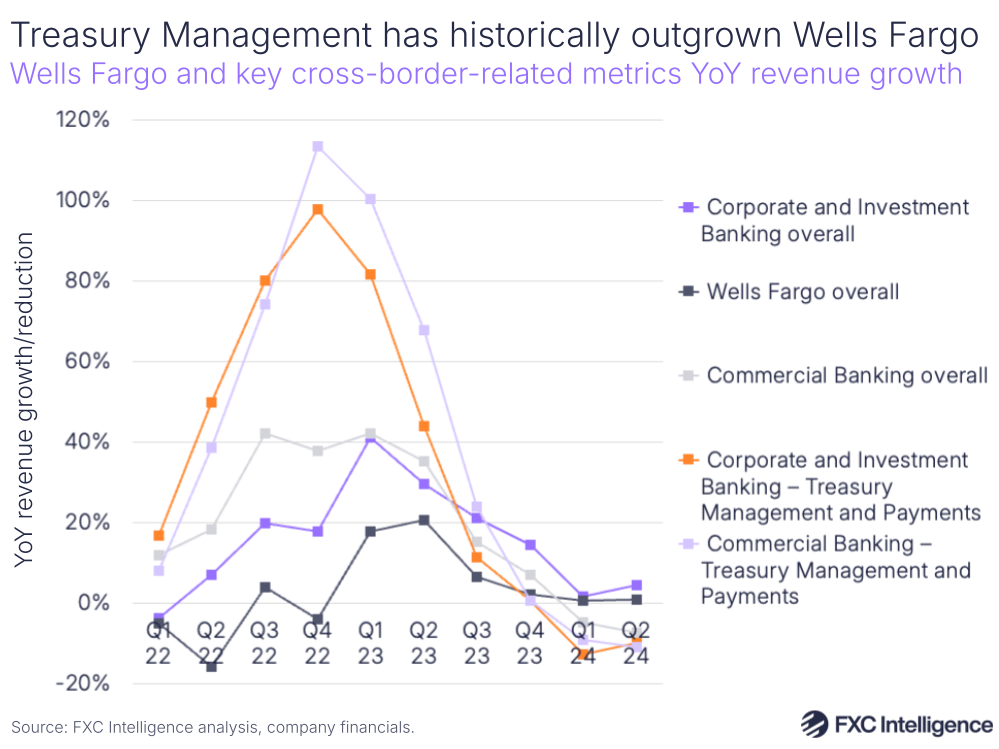
Finally, while Wells Fargo does not discuss cross-border payments directly, it does break out numbers that include its primary offering in this space, which is Global Treasury Management.
Covering domestic and cross-border payables and receivables, including commercial cards, controlled disbursement and merchant services, Wells Fargo provides its Global Treasury Management through two of its business segments: Commercial Banking (CB) and Corporate & Investment Banking (CIB).
Catering to large corporations, mid-sized companies, governments and non-profits, Commercial Banking sees the product reported in its earnings under Treasury Management and Payments.
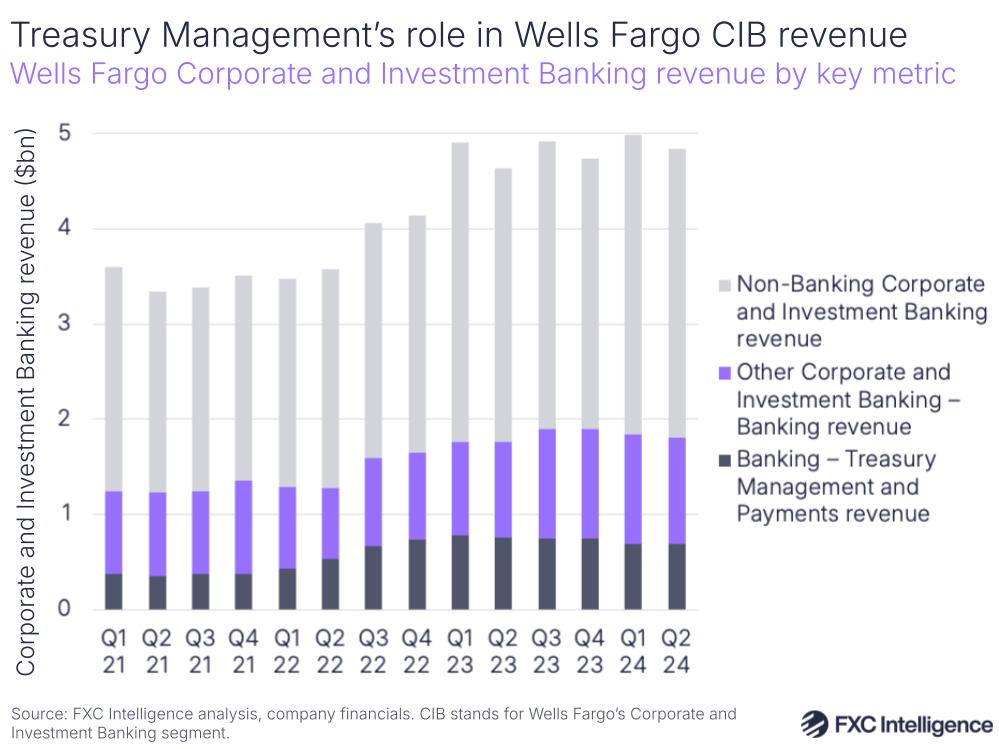
Meanwhile, Corporate & Investment Banking is designed for corporate, government, institutional and commercial real-estate clients and sees Treasury Management and Payments reported under the segment’s Banking unit.
Within Corporate & Investment Banking, Treasury Management and Payments accounted for 14% of the overall segment’s revenue in Q2 2024 and 38% of the Banking division it is a part of. However, this is slightly lower than it has been in the past, with Treasury Management and Payments seeing its highest share of Corporate & Investment Banking in Q4 2022, when it accounted for 18%.
In its latest earnings report, the company noted that lower treasury management results had offset increased activity across all products in the Banking division of this segment, as a result of interest rates impacting deposit costs. This followed the company’s FY 2023 earnings, where interest rates had helped this segment see YoY growth and increase balances.
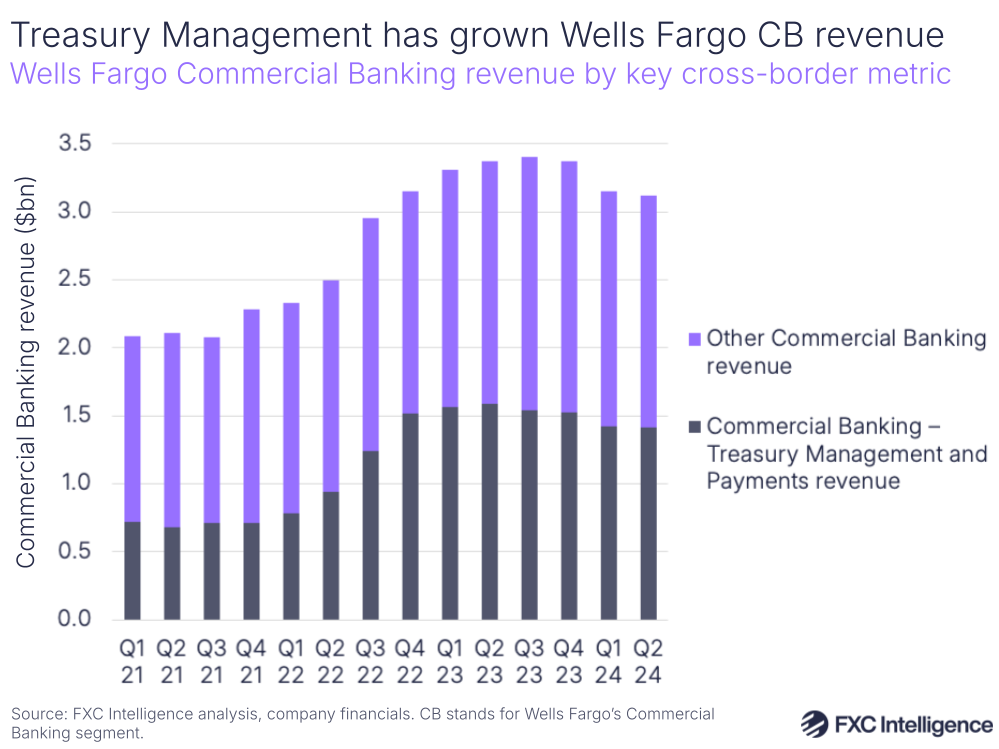
By contrast, Treasury Management and Payments is a bigger presence in Wells Fargo’s Commercial Banking segment, accounting for 45% of the segment’s revenue in Q2 2024 – a share it has had consistently for the past 12 months. Treasury Management and Payments has also been key to the prior growth of this segment, with its revenue share jumping from an average of 33% in 2021 to an average share of 40% in 2022 as the segment overall saw an upswing in revenue reported.
While the Commercial Banking segment saw a contraction in Q2 2024, treasury management fees were cited as an area of growth, particularly in the company’s middle-market banking offering.
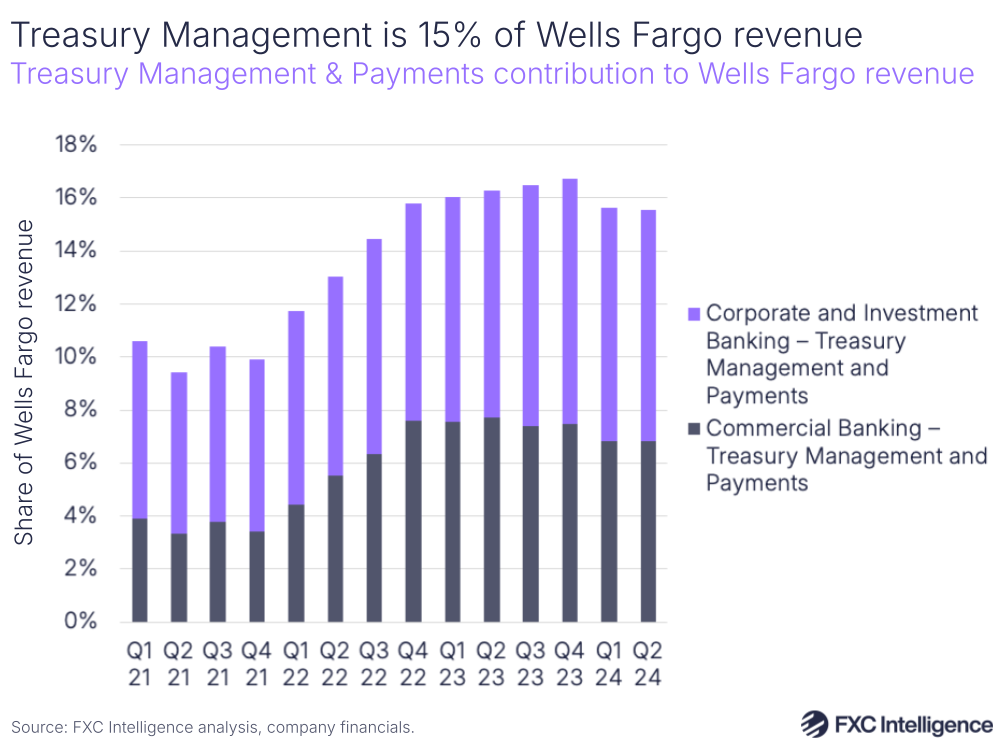
Looking at the contribution of Treasury Management and Payments in both Wells Fargo’s Commercial Banking and Corporate & Investment Banking segments, these together accounted for 16% of group revenue in Q2 2024, with a peak of 17% in Q4 2023. This has been a fairly steady share since Q4 2022, however it is an improvement on previous years, with the combined share averaging 10% in 2021.
While interest revenue (referred to by Wells Fargo as interest income) does contribute to these segments, it is crucially not the only driver of growth in this area. In the latest quarter, Wells Fargo also highlighted an increase in treasury management-related fees as a contributor to an increase in non-interest revenue.
Both Treasury Management and Payments reporting lines saw YoY contractions in the latest quarter, likely as a result of the changing interest revenue climate, however both have historically performed well above both their respective segments and Wells Fargo as a whole.
This peaked in late 2022 and early 2023, with Commercial Banking Treasury Management and Payments seeing an average quarterly YoY growth rate of 89% between Q3 2022 and Q2 2023, while the Corporate & Investment Banking Treasury Management segment as a whole saw an average of 76% YoY growth over the same period.
How are these banks pricing across key B2B corridors?
Implications for the banking and cross-border payments industry
Although it is not possible to gain precise cross-border-exclusive metrics for most, it’s clear that cross-border payments is a significant contributor of revenue for many banks, and in some cases may even have gained share of each group’s overall revenue over the past few years.
While 2023 performance was stronger for many than H1 2024 has been, this is for the most part the result of changes in interest revenue and so does not necessarily speak to long-term performance, while for some there is continued growth that shows no signs of slowing.
As a result, while non-bank players continue to report taking share from banks, there is not enough evidence to suggest that this is having a meaningful impact on the banks as yet.
However, while it is clear that behind the scenes many banks are working hard to maintain and even grow their sizeable share of the B2B cross-border payments market, this is not always translating into how the offerings are being discussed or reported by the banks themselves – and a lack of interest at this level can often translate into poorer investment in the departments themselves.
While both Standard Chartered and Citi regularly discuss and share metrics around cross-border payments, with the former regularly sharing direct revenue while the latter shares flows, these two are outliers among the 13 banks.
For the other 11, cross-border payments discussion is generally more muted and reporting is only as part of wider units, with any more detailed breakouts being limited to one-offs or individual comments. Despite this, these units generally represent significant revenue slices, suggesting that the impact of cross-border on the wider group is non-trivial.
Banks therefore have an opportunity. They own an immense share of a growing and evolving market, where expectations around delivery speed, transparency and digitisation are being raised each year.
While many are beginning to step up at a departmental level, not all are recognising the importance of this market at an executive level – and that may be translating into less board-level support to compete than some may need.
For the non-bank B2B payments market, banks’ immense share represents a vast TAM of untapped potential customers and banks need to be continuously stepping up to avoid shedding clients to such players. While some show strong awareness of this need, for others there is still room ahead.