FXC Intelligence data provides an update on our assessment of the total addressable market (TAM) for cross-border payments, globally and regionally, and now includes cross-border payments revenues and take rates.
Sat at the centre of the global economy – moving value for trade, powering supply chains, supporting households through remittances and enabling payouts to workers worldwide – the cross-border market’s scale, $208tn in 2025, is undeniable. However, scale is not the same as monetisation.
In 2025, the cross-border revenue pool totalled $625bn, spread unevenly between varying use cases across business and consumer, with take rates materially differing by use case and corridor. This report maps those differences across 2022 to 2025, showing how take rates are compressing across retail segments and reinforcing a simple point: flow growth and revenue growth don’t necessarily move together.
FXC Intelligence has spent the last decade developing datasets in the fiat and digital asset market and works with many of the industry’s leading players, placing it in a unique position to provide clarity about the size of the industry. A core part of this advantage is our direct relationships with industry participants, including providers, banks and platforms, which give us access to pricing and transaction data that is not available through public sources alone.
With coverage of over 850 players worldwide, including unique access to data we receive directly from participants in the industry, and historical intelligence comprising pricing and transaction speeds across more than 17,000 corridors in 175+ countries, FXC is distinctly placed to assess the cross-border payments market at large.
We also provide the underlying data for the two main global indices in the cross-border sector: the Financial Stability Boardʼs KPIs for the G20 Roadmap for Enhancing Cross-border Payments and the World Bankʼs Remittance Pricing Worldwide.
Methodology and scope
To accurately determine the global TAM of cross-border payments, this report looks at the market through two lenses: payment flows (where money moves) and, for the first time, revenue pool (where providers earn revenue).
This report focuses on retail cross-border payments by use case. A use case or segment defines the type of cross-border payment flow based on the combination of the sender (consumer/business) and receiver (consumer/business). The four use cases in this report are: business-to-business (B2B) payments – covering small and medium-sized business (SMB) goods and services and large enterprise goods and services; consumer-to-business (C2B); business-to-consumer (B2C); and consumer-to-consumer (C2C) payments. Throughout this report, the wholesale market is referenced for context and is not sized in depth.
Central to this analysis is FXC Intelligence’s proprietary dataset, which comprises FX margin and cross-border fees data across an extensive range of corridors, markets, regions and use cases. This depth of granularity enables revenue analysis at the corridor level, with the ability to aggregate systematically up to full market and regional views.
Revenue is calculated for each corridor and for each use case on that corridor by combining provider revenue earned from the exchange rate spread with cross-border fee revenue charged to customers (including any fees applied when a payment is sent or received).
Estimates for B2B take into consideration currency of invoice (e.g. share of invoices in home currency or USD), as this determines the extent to which foreign exchange conversions are applied.
The corridor-by-corridor revenues are aggregated to get regional and global totals per use case. The total revenue is then also expressed as a percentage of aggregated corridor flows to derive the revenue take rate.
The size of the cross-border payments market: 2025 to 2033
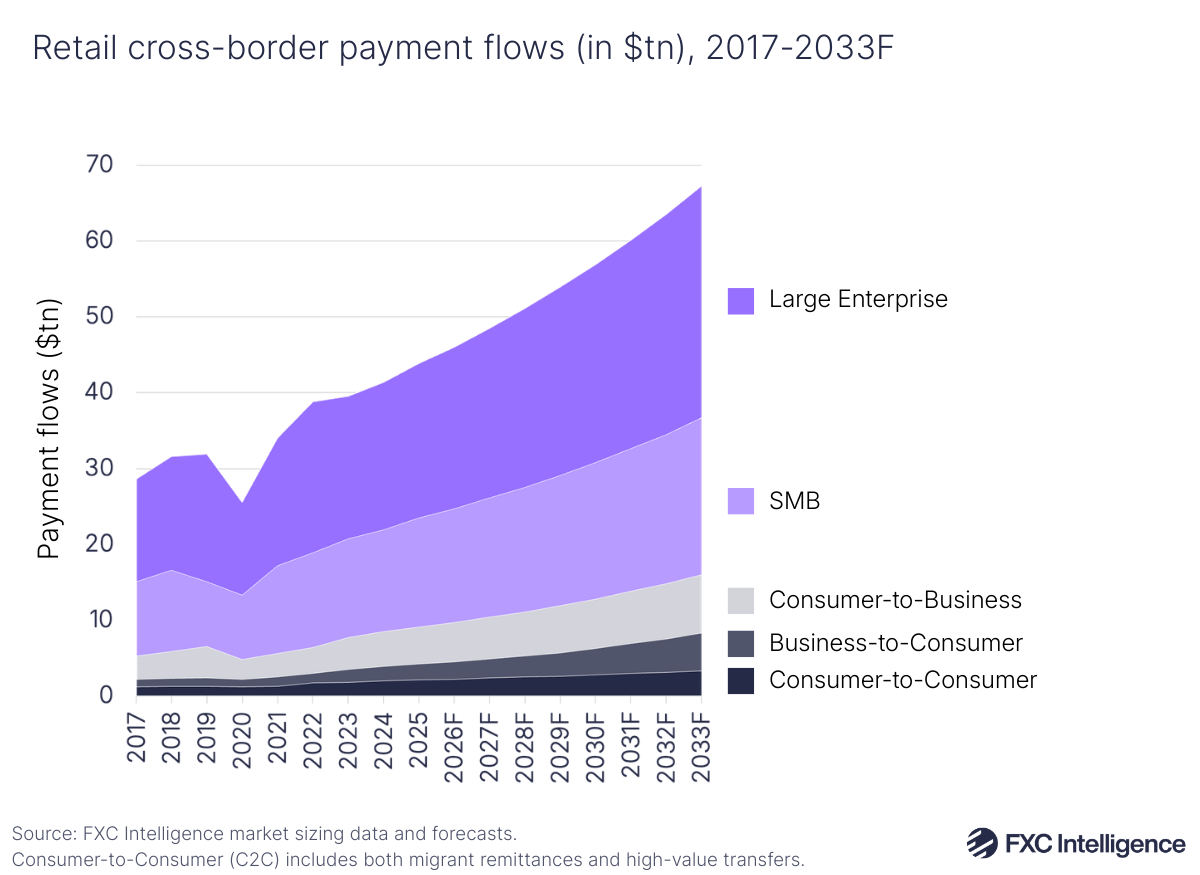
FXC Intelligence’s data shows that the retail cross-border industry had a global TAM of $44tn in 2025. This is made up of global payment flows for large enterprise goods and services; SMB goods and services; C2B; B2C; and C2C payments.
Comparatively, wholesale cross-border payments have a much larger global TAM, sitting at $164tn in 2025. Combined, this puts the entire wholesale and retail cross-border payments market at a TAM of $208tn in 2025.
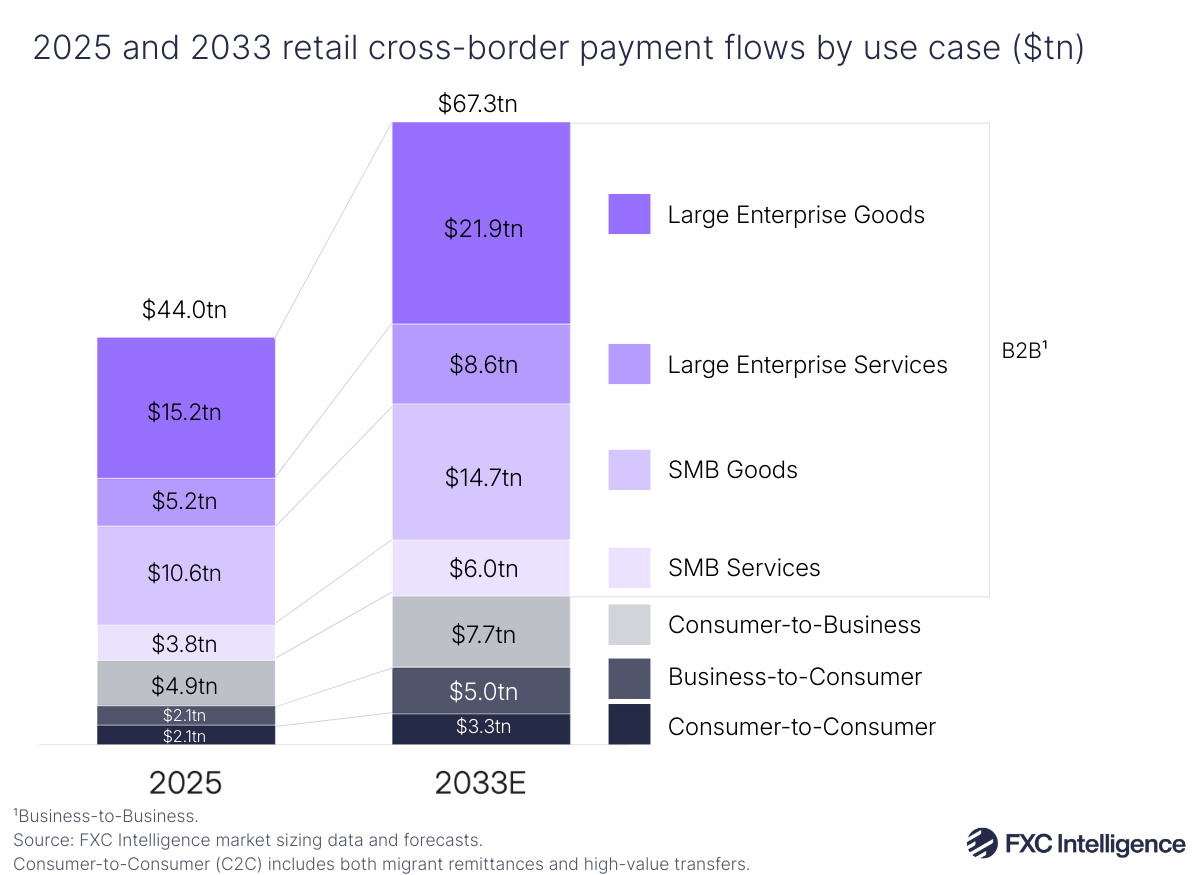
FXC Intelligence’s market sizing data also forecasts the size of the retail cross-border market in 2033, showing that its TAM is set to grow 53% to $67.3tn, with a compound annual growth rate (CAGR) of 5.5%.
It is important to note that the biggest flows do not represent the largest sources of revenue. While the wholesale market dominates the flow of cross-border payments, the retail market generally has significantly larger take rates. Wholesale payments represent 79% of all cross-border flows but only have a 26% share of the revenue – this is largely due to high levels of competition, standardisation and tighter pricing across the market. Business-to-business (B2B) SMB payments, by contrast, only represent a 7% share of cross-border payments, but have a 31% share of total revenues (the largest of any segment).
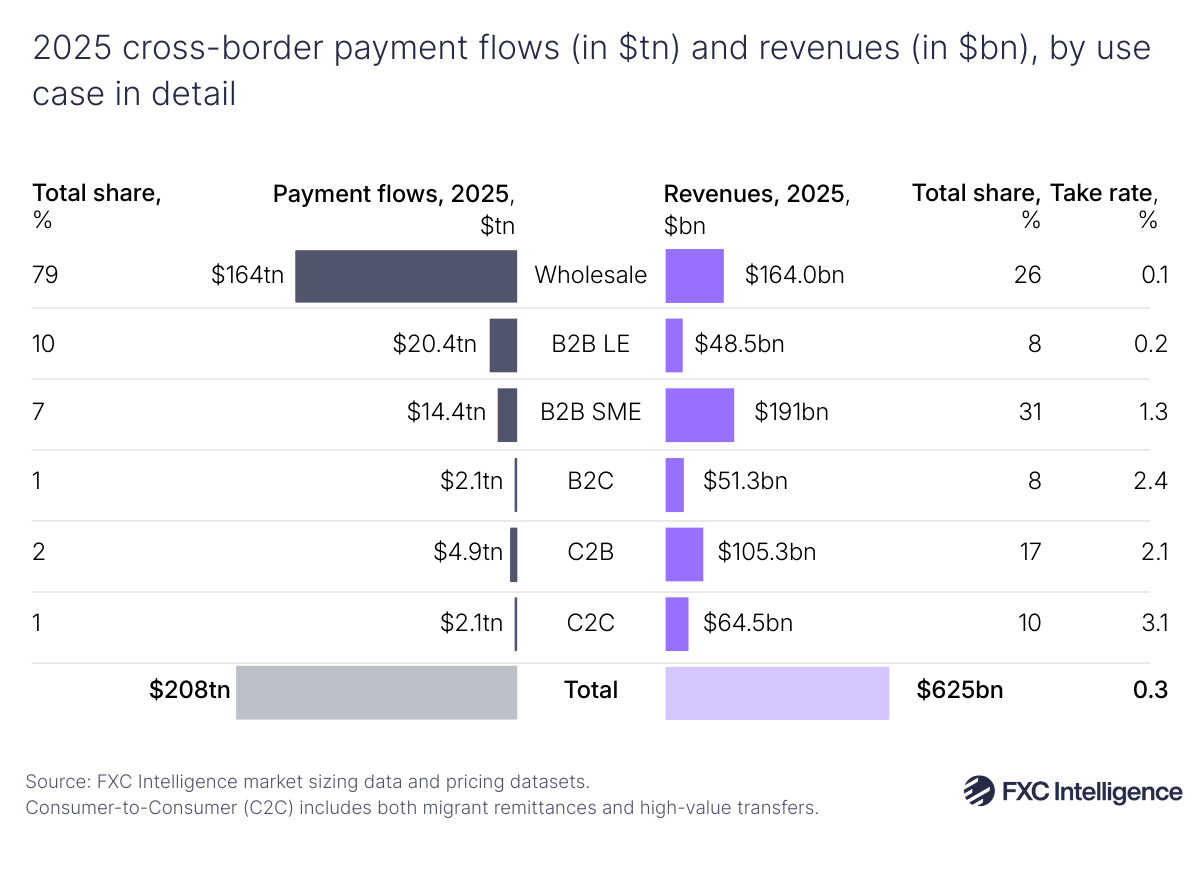
However, take rates vary significantly depending on the use case, which is why flows and the revenue pool do not move in lockstep. In 2025, C2C had the highest take rate (3.1%), followed by B2C (2.4%) and C2B (2.1%), while B2B ranges from 0.2% (large enterprise) to 1.3% (SMEs). The result is a very different revenue profile from the flow picture: for example, B2B SME flows generate the largest single retail revenue pool ($191bn) despite not being the largest flow segment.
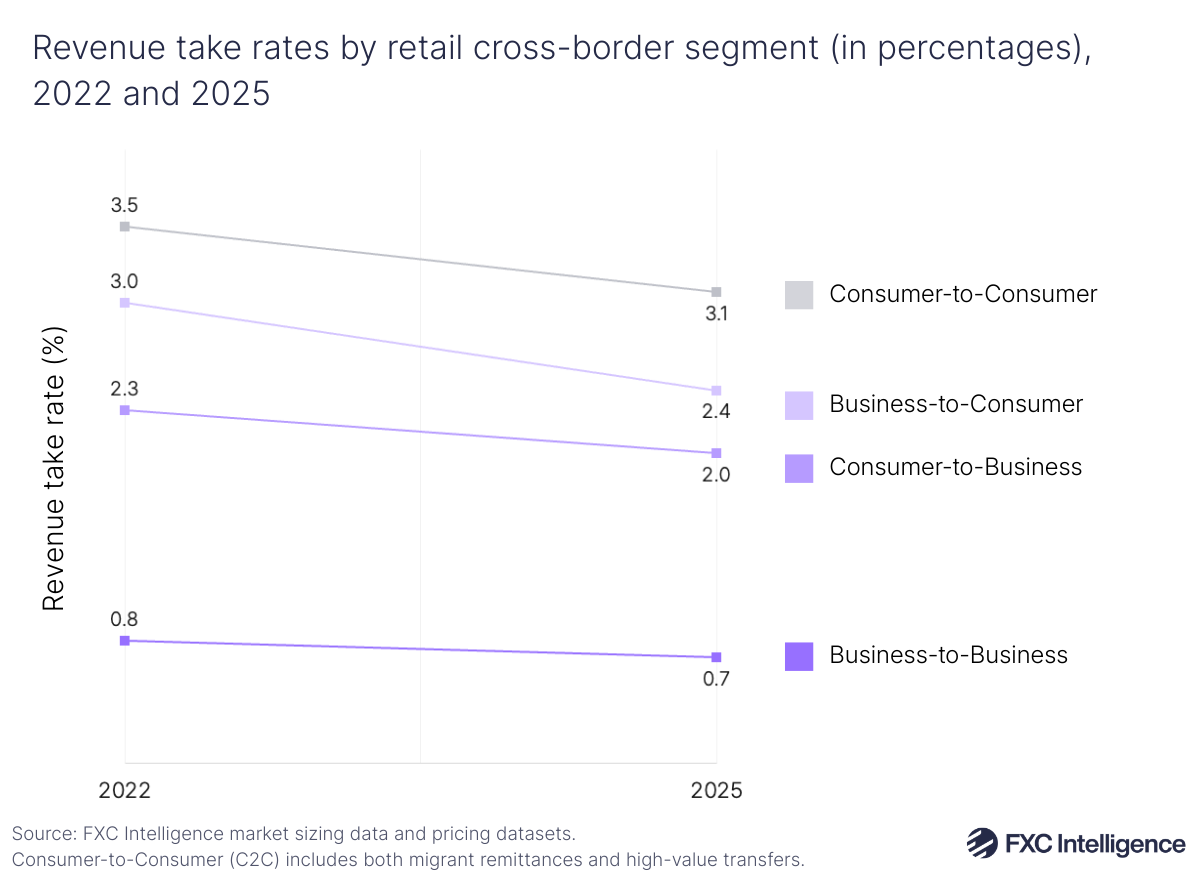
Notably, as seen in Figure 3, between 2022 and 2025 every segment of the retail cross-border payments market saw a drop in take rates, meaning the revenue pool has grown more slowly than flows. This degree of compression has been not uniform however: the steepest relative decline was in B2C (19%), while B2B (12%) was comparatively more resilient over the same period.
The compression shown reflects a combination of effects, including changes in pricing and changes in flow. In particular, shifts in corridor flows, provider presence and service composition (e.g. changes in payment instruments) can move blended take rates even where like-for-like pricing is unchanged. The practical reading is that volume growth is not necessarily a reliable proxy for revenue growth; corridor and segment mix increasingly determine outcomes, so take-rate trends need to be tracked alongside flow expansion when considering new corridors or customers.
Get in touch to find out how FXC’s market sizing data can help your organisation
Cross-border payments market trends
Since 2017, cross-border growth has not been linear, largely thanks to the impact of the Covid-19 pandemic. B2B cross-border payments were impacted significantly during this period, seeing payment flows contract more than any other segment during 2019 and 2020.
Following this, the market recovered, seeing unusually high year-on-year growth – although this growth rate slowed between 2022 and 2023, impacted by the war in Ukraine and subsequent high inflation. Cross-border growth picked up again by 2024, although recent policy measures and global uncertainty once again slowed growth coming up to 2025.
Tariffs are becoming persistent planning variables for providers, with some businesses choosing to reroute goods and payments through countries where lesser tariffs have been imposed. While trade diversion and rerouting can appear to bolster short-term resilience, this process can be structurally costly and act as a long-term drag on growth.
Although traditional goods-based trade faces tariff headwinds, services are increasingly delivered remotely, supporting a rise in cross-border digitally delivered services and platform work and B2B service payments. Meanwhile, labour mobility restrictions, such as immigration policies, appear to be driving more people toward online platform work, where businesses pay global networks of freelancers and contractors. This expansion of the gig economy is increasing demand for improved mass global payout capabilities – a key driver behind B2C growth.
Looking to the future, B2B is set to be the biggest driver of cross-border payment growth between 2025 and 2033, accounting for 70% of the expected increase in retail cross-border payments during this period. B2C cross-border payments are forecast to see the fastest growth of all segments and will represent 13% of overall growth up to 2033, while C2B represents 12%, followed by C2C at 5%.
How big is the B2B cross-border payments market?
B2B cross-border payments are those sent by businesses to other businesses and includes goods and services payments from both large enterprises and small and medium-sized businesses (SMBs).
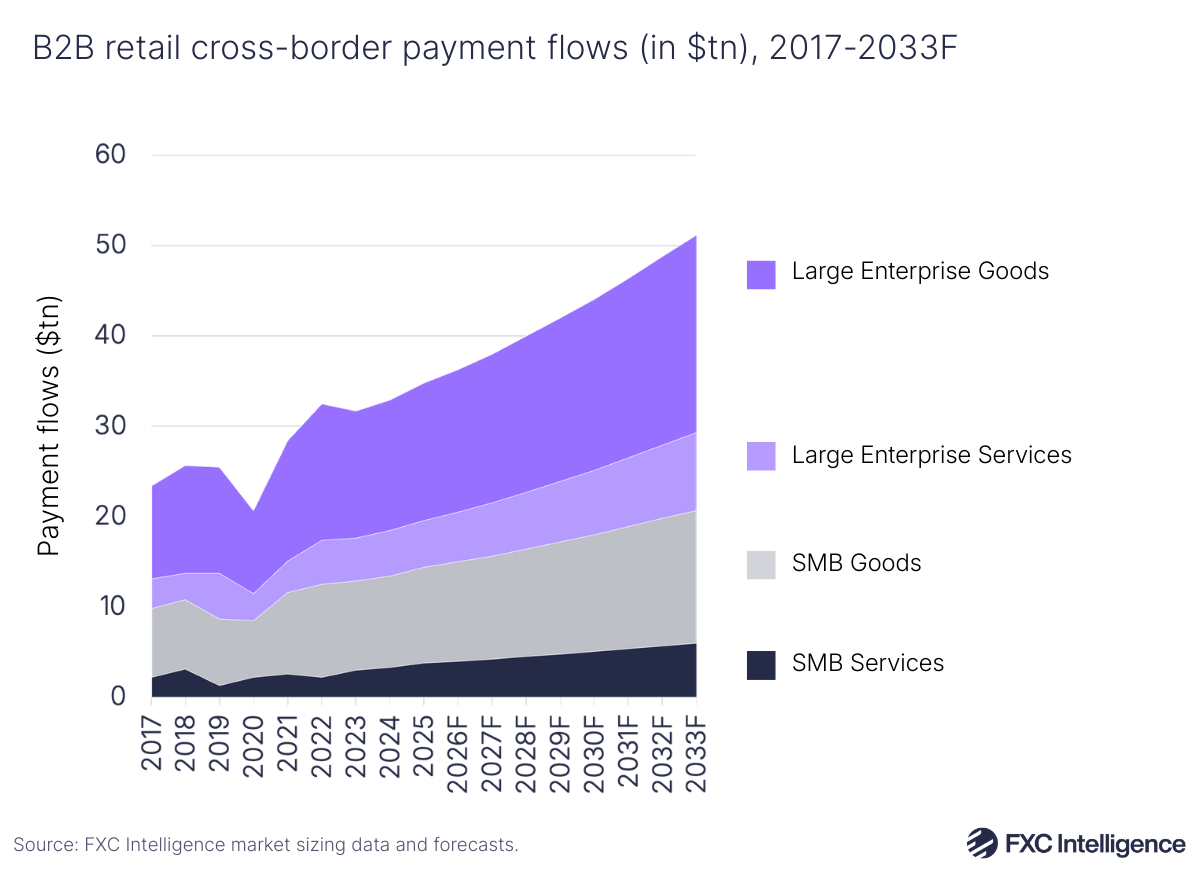
As of 2025, the B2B cross-border payments market had a total global size of $34.8tn and looks set to grow by 47% to $51.2tn in 2033, with a 4.9% CAGR. For comparison, B2B had a slightly higher CAGR of 5.1% between 2017 and 2025.
Within B2B, there is variation between segments. Large enterprises (including goods and services) had an overall global TAM of $20.4tn, which is projected to grow 50% to $30.6tn in 2033, with a CAGR of 5.2%. Within this, large enterprise goods represents the largest B2B segment, with a $15.2tn TAM in 2025, climbing to $21.9tn in 2033 (with a CAGR of 4.7%). Large enterprise services, meanwhile, sat at $5.2tn in 2025 and is forecast to increase to $8.6tn in 2033 (6.5% CAGR).
Overall, SMB had a 2025 global TAM of $14.4tn, set to rise to $20.7tn in 2033 – a growth rate of 43% and a CAGR of 4.6%. Within this, SMB goods had a 2025 market size of $10.6tn, rising to $14.7tn in 2033 (4.1% CAGR), while SMB services had a 2025 market size of $3.8tn, increasing to $6tn in 2033 (5.9% CAGR).
Large enterprise services are expected to grow faster than SMB services up to 2033 because they are better equipped to leverage global markets to capitalise on the favourable environment for services growth than smaller businesses. While we forecast the SMB goods segment to see slower growth than the services segment, it is also slower compared to its 4.3% CAGR between 2017 and 2025. This comes as a result of it being negatively impacted by persistent uncertainty around current trade policy and higher supply-chain costs.
How does B2B revenue vary depending on region?
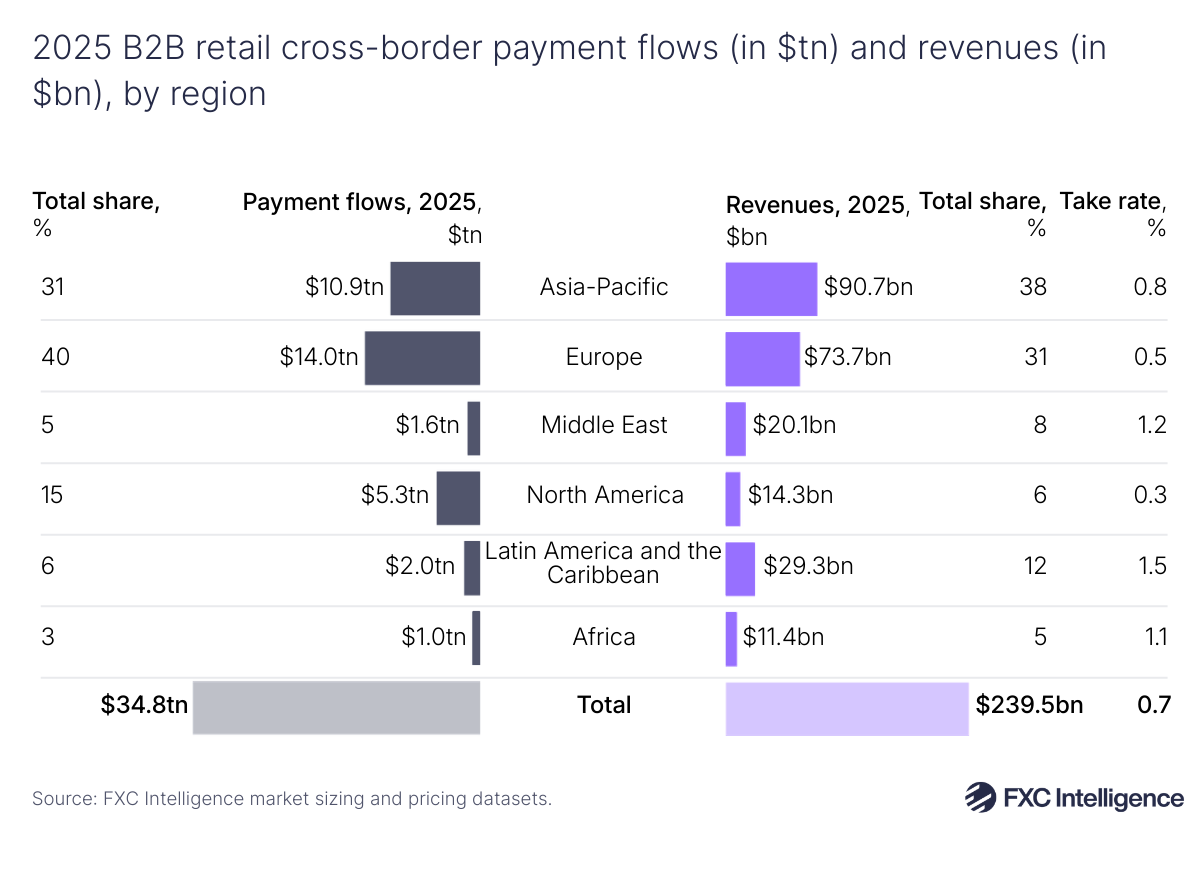
Regional differences exist in revenue per unit of flow, often depending on varying liquidity depth, competition and other payment frictions. B2B revenue take rates are often higher in regions with higher levels of FX volatility, as well as operational and compliance friction, while take rates are lower in regions where liquidity is deeper and stronger competition exists.
A significant share of B2B flows are sent through banks, meaning more mature banking services in the likes of North America and Europe contribute to lower regional revenue take rates. In comparison, regions that see higher levels of FX volatility and greater friction usually have higher take rates.
While the take rates seen in Asia-Pacific exceed those of North America and Europe, they are relatively low compared to Latin America, the Middle East and Africa, due to the region’s diversity and combination of markets with both sets of characteristics.
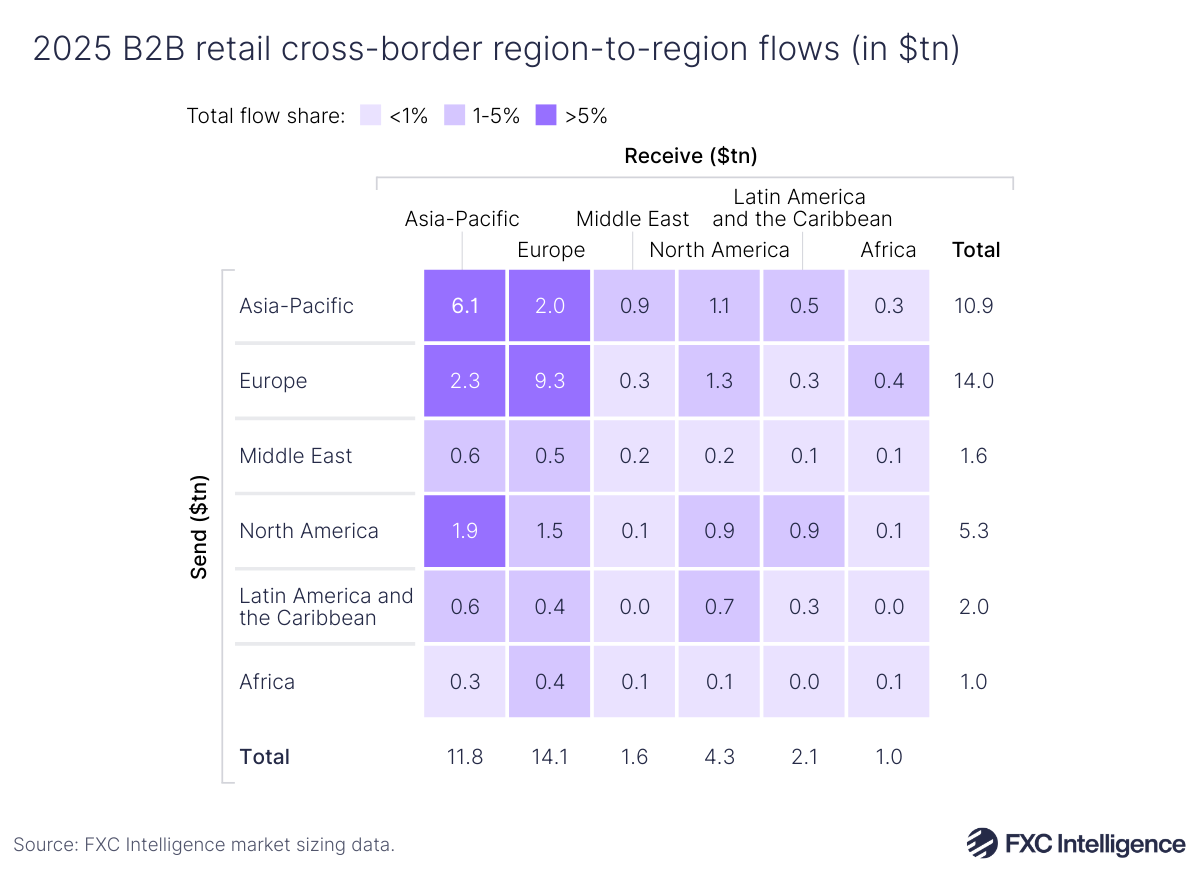
Equally, corridor structure is a key driver of revenue take rates, with intra-regional flows often correlating with stronger rails and tighter pricing dynamics. Around 49% of all B2B retail flows globally are intra-regional, with intra-regional flows outweighing inter-regional flows in both Asia-Pacific and Europe.
Higher intra-regional flows within Europe comes as a result of both dense supply chains and deep regulatory integration (such as SEPA), which contribute to lower levels of payment friction. Within Asia-Pacific, trade in intermediate goods (components which are used to produce final products) is high, resulting from deepening links between other markets and China, and drives this intra-regional trend. Additionally, while in APAC this trend is more goods-driven, in Europe both services and goods are skewed in favour of intra-regional flows.
For each of the other regions globally – namely Latin America and the Caribbean, the Middle East, North America and Africa – inter-regional flows were larger than intra-regional flows.
How can I compare pricing to other B2B companies?
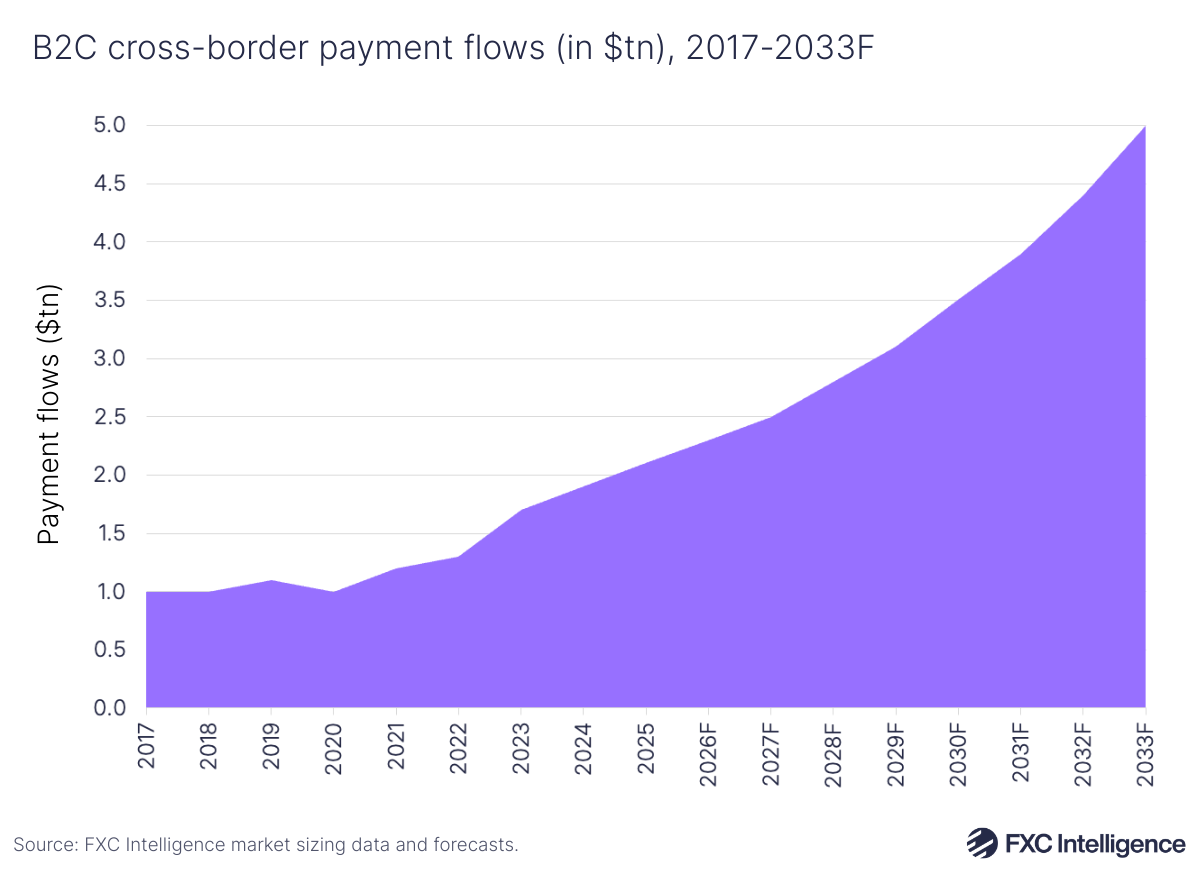
How big is the B2C cross-border payments market?
B2C cross-border payments include the payment of international workers via both international payroll to employees and payouts made through the gig economy via platforms like Uber, as well as social media payouts.
In 2025, B2C had a cross-border TAM of $2.1tn and is set to see faster growth than any other segment, rising 138% to $5tn in 2033, with a CAGR of 11.4%. This suggests that B2C growth going forward will outpace that in recent years, with the segment having seen a 10% CAGR between 2017 and 2025.
Expansion of the digital economy, as well gig and creator payouts look set to be significant factors behind B2C cross-border payment growth outpacing all other segments. Some parts of this growth will also be tied to gains made in the wider cross-border payments market, including those from payment infrastructure improvements that reduce frictions and improve standardisation (such as ISO 20022) and targets for fee reductions and improving settlement times (including the G20 Roadmap for Enhancing Cross-Border Payments).
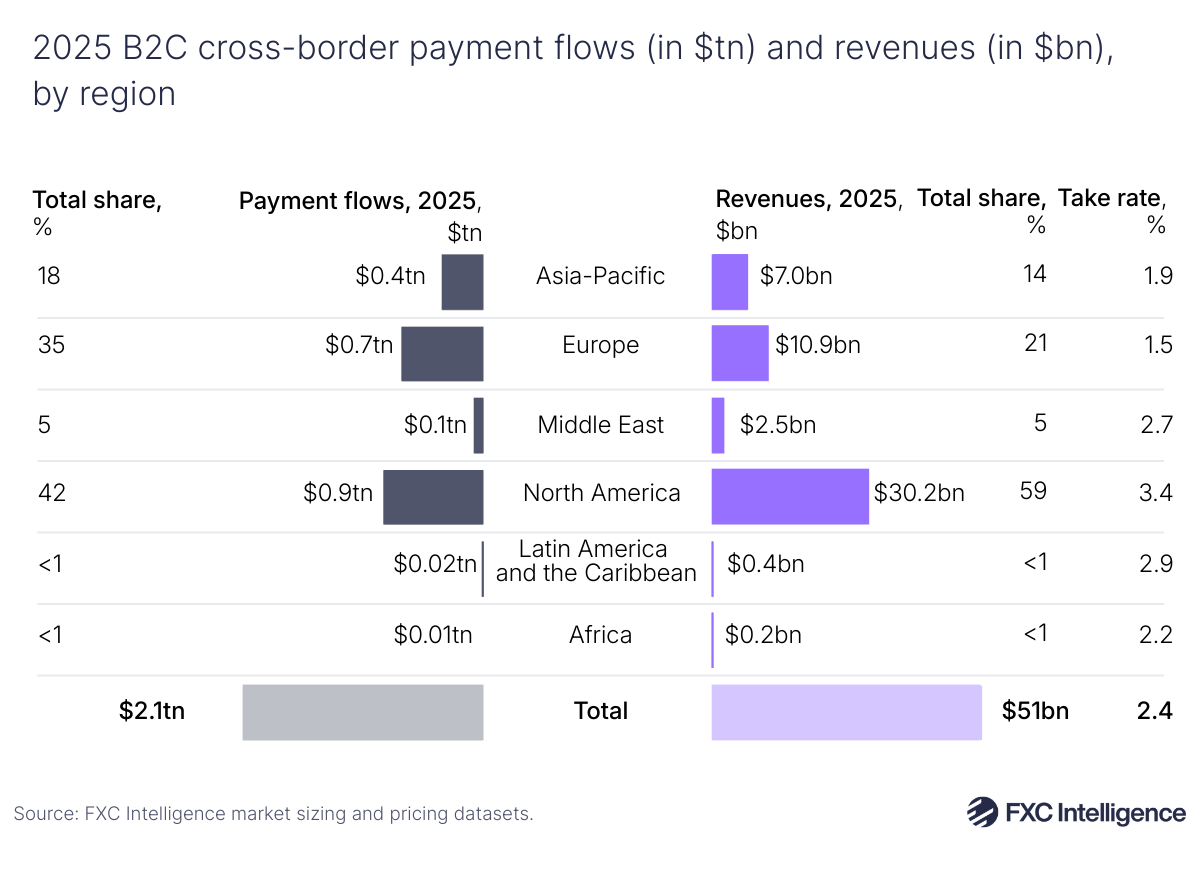
How does B2C revenue vary depending on region?
Like B2B revenue, B2C monetisation is not uniform across different regions, with over 75% of cross-border B2C flows originating from North America and Europe.
North American flows consist primarily of B2C flows from the US, where a sizable share of global digital platforms that make mass payouts are headquartered. While North America (3.4%) has the highest B2C payments revenue take rate globally, Europe (1.5%) has the lowest.
This disparity largely comes from Europe having a far more competitive cross-border B2C payments environment, with more efficient payment rails and more intra-regional flows than inter-regional. Meanwhile, North America sees more inter-regional flow of B2C payments. In addition to price, mass payout providers are also able to differentiate on value-added services. Some of these services include instant availability, compliance and orchestration.
How can FXC Intelligence’s market sizing data help my business?
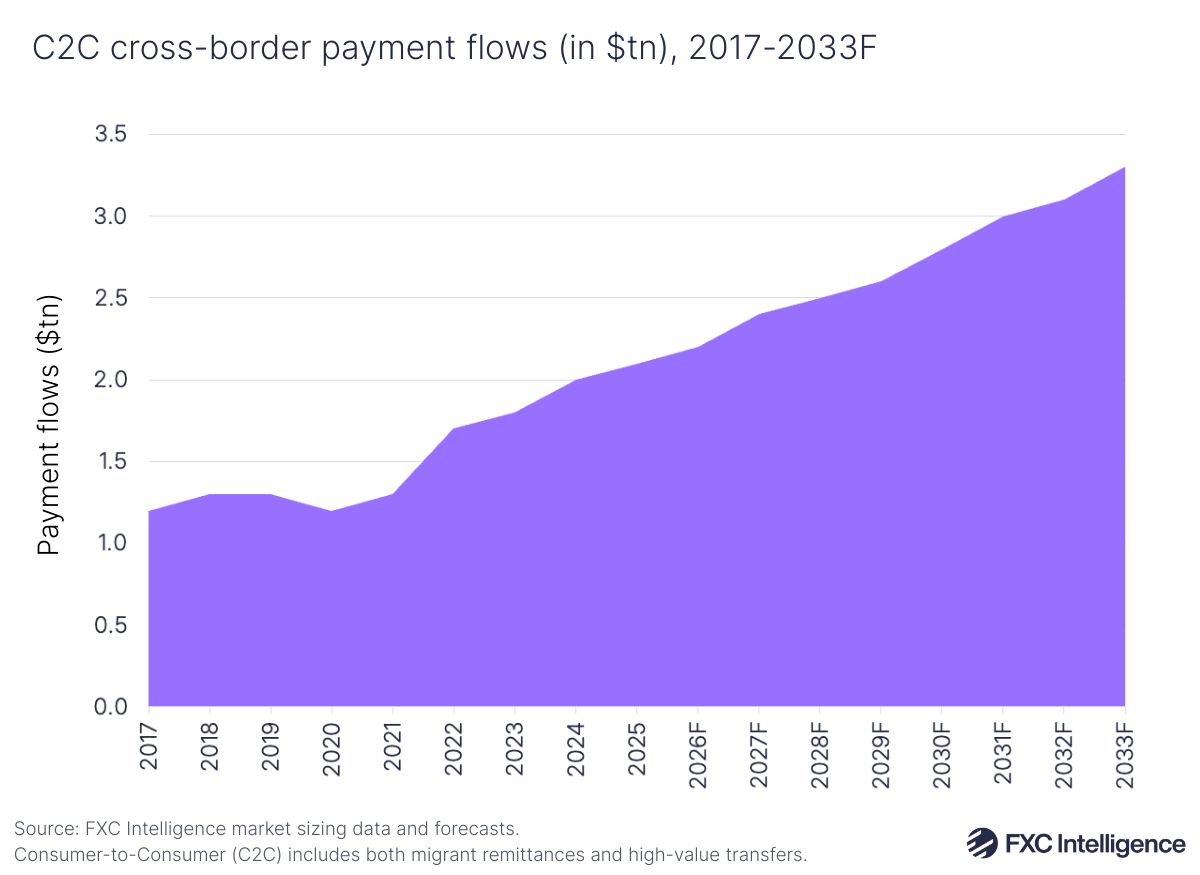
How big is the C2C cross-border money transfers market?
Also known as person-to-person (P2P) payments, the C2C payments market covers all consumer money transfers, including both migrant remittances and high-value transfers.
C2C cross-border payments had a global TAM of $2.1tn in 2025 and the segment is forecast to grow to $3.3tn in 2033 – a growth rate of 57% and 5.8% CAGR. This would see C2C growth slow compared to the 7.6% CAGR seen between 2017 and 2025, despite pandemic-related headwinds during that period.
While future migration will depend on changing policies, migrants already located in key remittance sending countries are expected to contribute to growth for this segment. Progress towards global targets for faster, more transparent and standardised anti-fraud data tracking – like the G20 cross-border roadmap and the FATF Travel Rule – should also support growth in C2C high-value transfers.
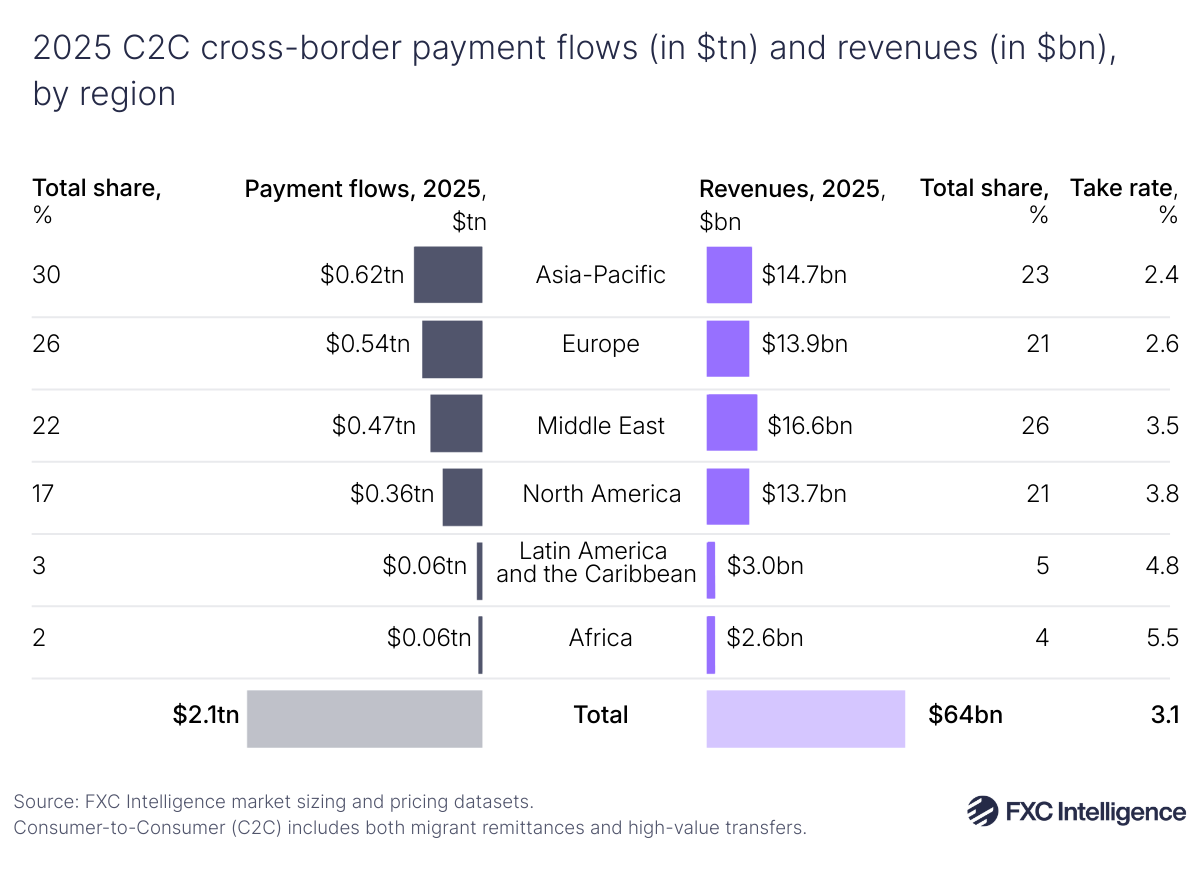
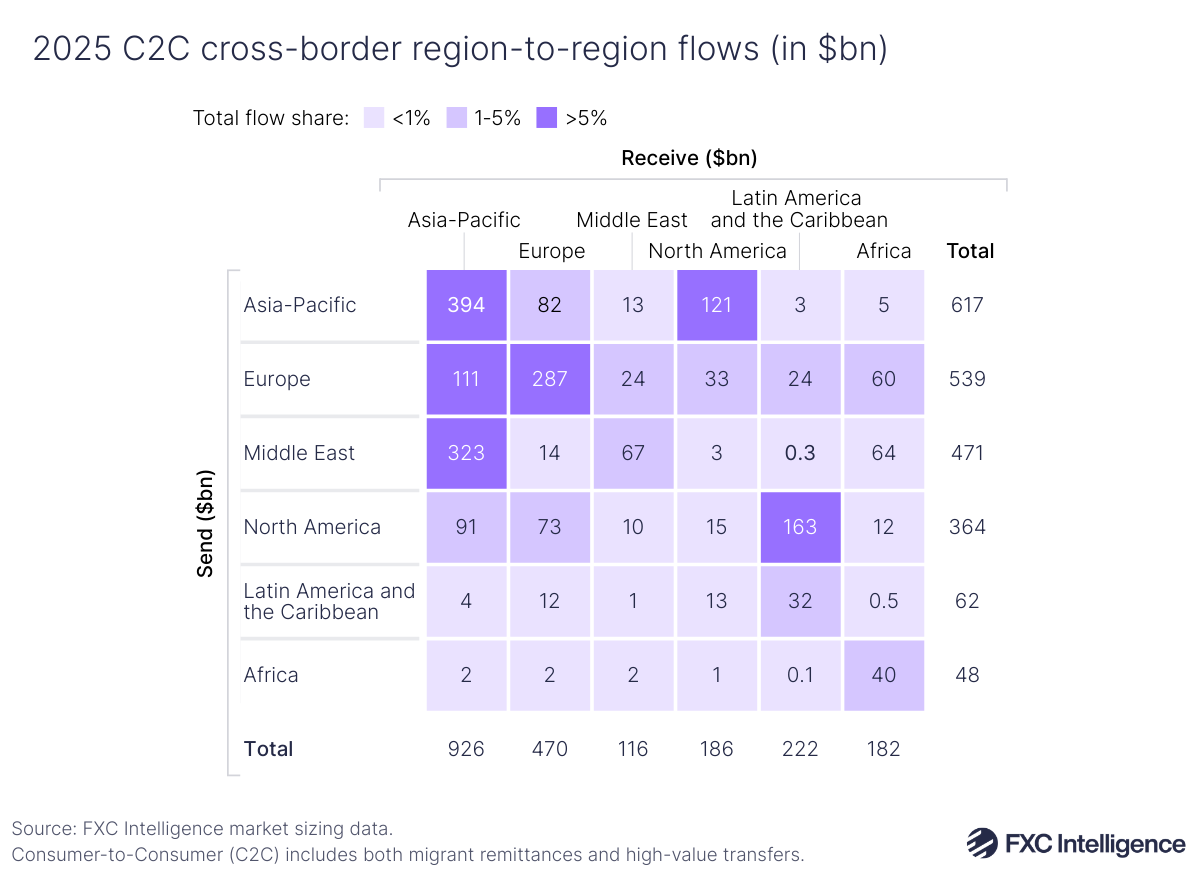
How do C2C flows and revenue vary depending on region?
Consumer money transfers typically have high margins compared to other segments, caused by a variety of factors. There is increased fragmentation of providers and their specialisations, as well as the wide range of payout methods offered throughout this segment. For example, C2C remittances often involve more payout options – including cash, e-wallet and mobile money agents – than other retail segments. However, these C2C take rates still vary significantly depending on the region.
Around 70% of cross-border C2C flows and revenues originate from Asia-Pacific, Europe and the Middle East, but revenue take rates are the highest in regions like Latin America and Africa, where physical cash dominates. Revenue take rates are lowest in Asia-Pacific and Europe, where prices have been driven downward by high levels of competition from digital providers, stronger regional payment system links and initiatives pushing for cheaper transfers.
Looking at the segment’s regional movement of money, inter-regional corridors make up around 60% of all C2C flows. The Middle East to Asia-Pacific is the top inter-regional corridor globally, driven by key corridors such as Saudi Arabia to India and the UAE to India, as well as other remittances sent by foreign worker hubs in Gulf Cooperation Council countries to countries in Asia-Pacific, including India, Bangladesh and Pakistan.
Second to this corridor is North America to Latin America, which is largely driven by remittance flows along the US to Mexico country-corridor.
Asia-Pacific and Europe drive the majority of volume for intra-regional C2C transfers, which represent 40% of all C2C flows.
Get in touch to find out more about our global C2C pricing dataset
How big is the C2B cross-border payments market?
C2B cross-border payments, those made by consumers to businesses, include both travel-related spend and cross-border e-commerce purchases.
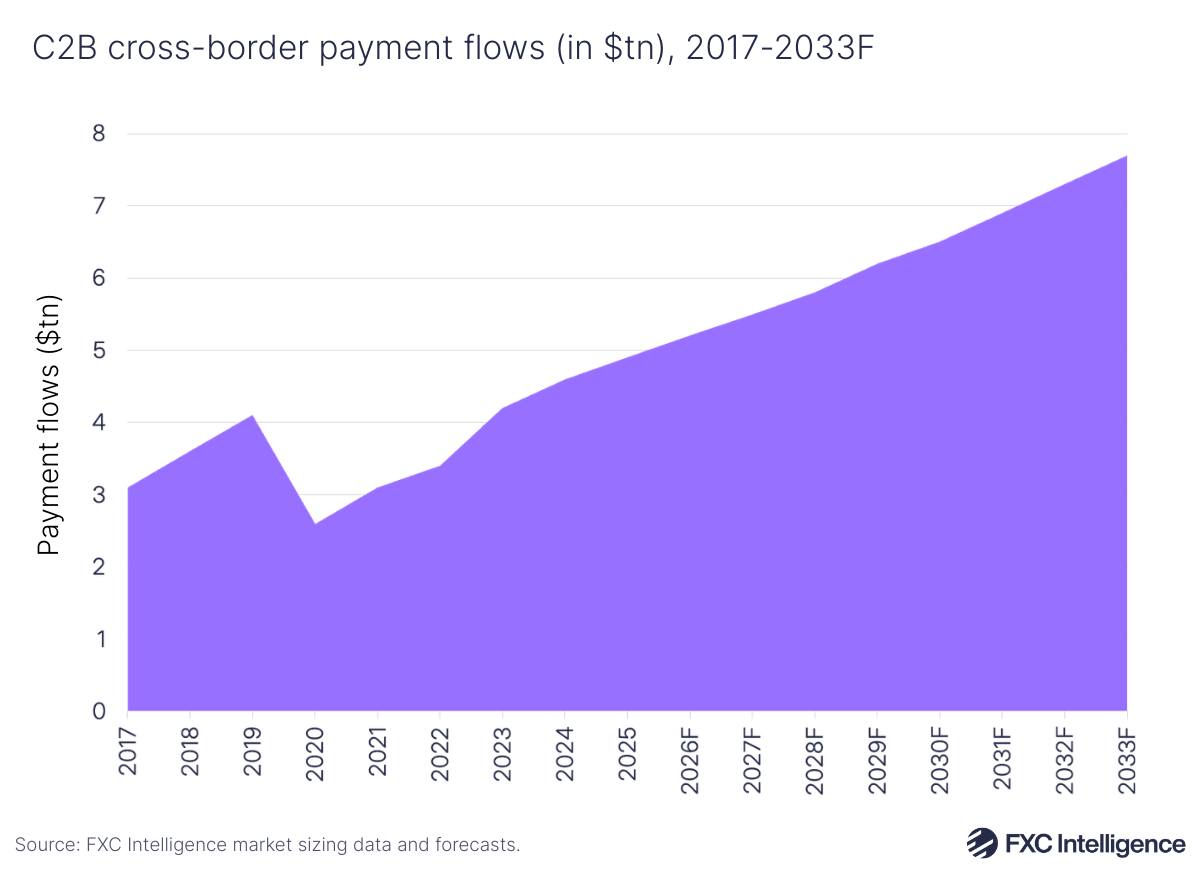
In 2025, C2B had a cross-border TAM of $4.9tn and is set to increase by 57% to $7.7tn in 2033, with a CAGR of 5.8%. This represents relatively steady growth, with the segment seeing a 5.9% CAGR between 2017 and 2025. This comes in spite of global economic slowdown, with two key factors contributing to C2B growth.
Since the Covid-19 pandemic, the travel and tourism sector has seen continued recovery and this growth is expected to continue. Ecommerce has seen similar growth in recent years, although the expected increase in international demand could be impacted by tariff volatility.
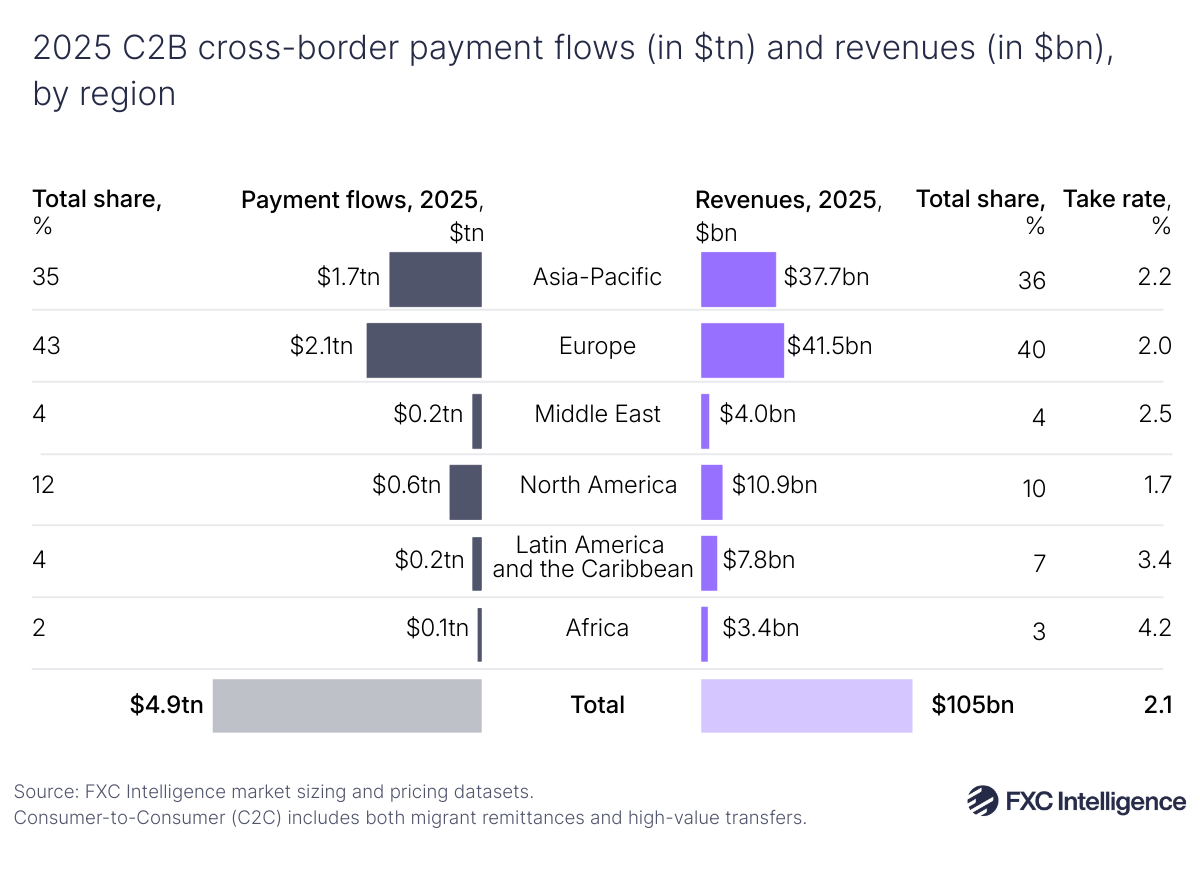
How do C2B flows and revenue vary depending on region?
Asia-Pacific and Europe dominate C2B cross-border payment flows and revenues, collectively accounting for 70% of the global total. Asia-Pacific has the third-lowest revenue take rate globally at 2.2%, while Europe has the second-lowest at 2%.
Only North America has a lower take rate globally, with a 1.7% take rate. This comes as a result of the region’s highly mature, card-dominated financial infrastructure leading to stronger price competition between payment providers.
Meanwhile, Latin America and Africa have the highest revenue take rates of all regions for this segment, at 3.4% and 4.2% respectively. For both of these regions, this is driven by significant levels of currency volatility, thin liquidity and a more complex regulatory environment, leading many providers to view these regions as higher risk and therefore set higher prices.
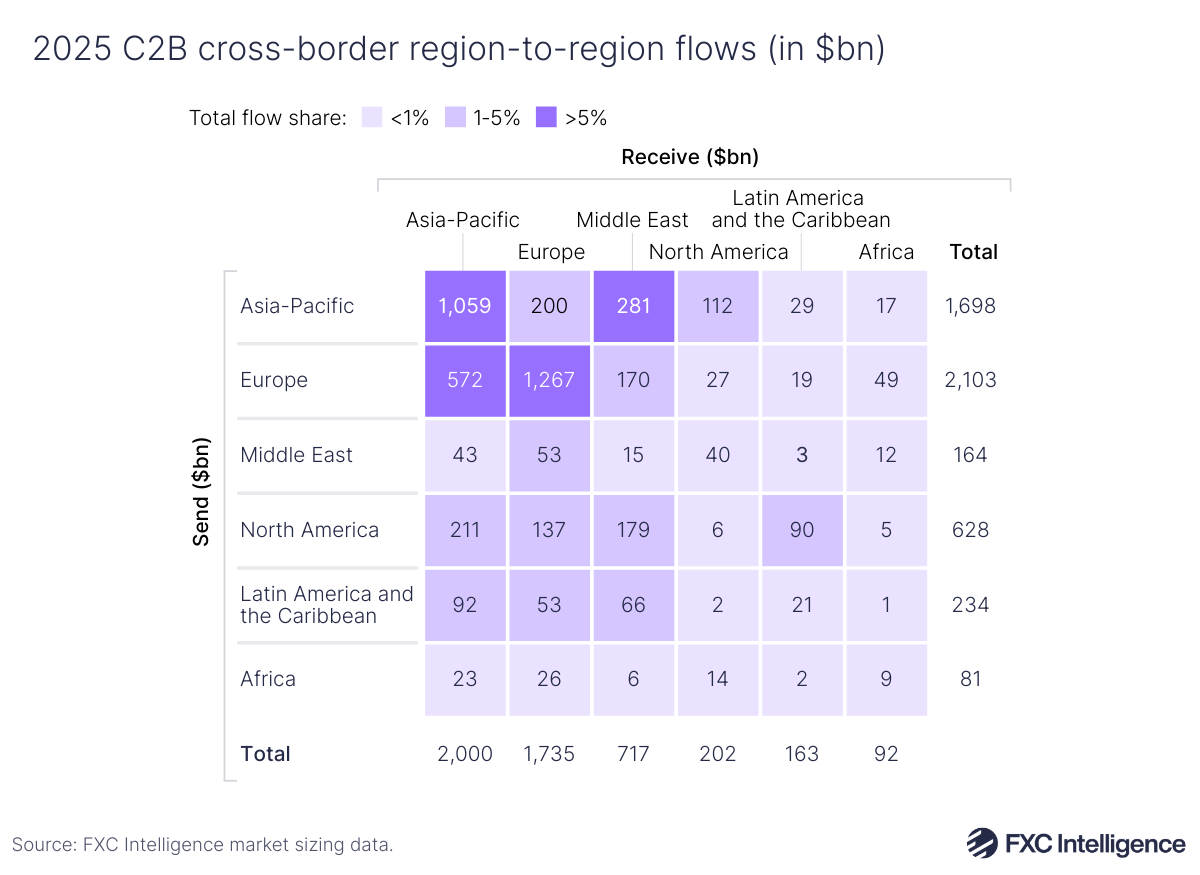
Asia-Pacific and Europe are key C2B sending and receiving regions; both regions make up over 75% of C2B cross-border flows sent or received. While Europe is the largest destination for tourists and receives more inbound travel flows, Asia-Pacific is the largest ecommerce base and receives more inbound ecommerce flows.
Elsewhere, North America accounts for 13% of outbound cross-border C2B flows, combining steady outbound tourism demand and a large e-commerce market.
Key takeaways
It is clear that flows and revenue are not equal. While wholesale cross-border payments dominate total global flows, the retail segments account for a disproportionately large share of the cross-border revenue pool and higher revenue take rate.
Within retail cross-border, B2B represents the majority of flows in 2025 and looks set to remain the dominant use case in 2033. But the makeup of B2B flows is also changing, with growth gradually shifting more towards services, even while goods remain the larger base. Despite this shift, goods are still set to contribute the majority of B2B retail cross-border payment flows come 2033 because of the segment’s larger starting point.
Revenue take rates vary materially by region, with regional flows, revenue pool and take rate figures consistently dispersed across B2B, B2C, C2C and C2B. More developed and liquid regions tend to exhibit lower revenue take rate, while regions with higher FX volatility and operational complexity tend to exhibit higher take rate.
Intra-regional payments are a major feature of cross-border, particularly for B2B and C2B. A substantial share of B2B and C2B flows are intra-regional in Europe and Asia-Pacific, while C2C flows remain concentrated in a smaller set of inter-regional corridors, shaping both growth and take-rate profiles.
The corridor view is essential for interpreting both growth and revenue take rate. Our region-to-region matrices demonstrate that corridor concentration differs by use case, which is why regional aggregates can mask meaningful corridor-level dynamics in both flows and the revenue pool.
Accessing FXC Intelligence’s market sizing data
FXC Intelligence has developed rich, highly granular datasets on the size of the total addressable cross-border payment market at a country and corridor level for each segment of the industry, providing market sizing datasets that can be both leveraged independently or combined with other core datasets and platforms to build a comprehensive industry strategy.
As the market leader in cross-border payments data, our products and solutions are critical to many leading companies in the industry, including some of the world’s biggest banks, technology companies, payment providers and NGOs.